
Reason to trust
How Our News is Made
Strict editorial policy that focuses on accuracy, relevance, and impartiality
Ad discliamer
Morbi pretium leo et nisl aliquam mollis. Quisque arcu lorem, ultricies quis pellentesque nec, ullamcorper eu odio.
[vc_row][vc_column][vc_column_text]Bitcoin price is attempting an upside break above the $28,500 resistance zone. BTC could rally if there is a close above the $28,500 resistance zone.
- Bitcoin is gaining pace above the $28,000 resistance.
- The price is trading above $27,500 and the 100 hourly simple moving average.
- There is a key bullish trend line forming with support near $27,780 on the hourly chart of the BTC/USD pair (data feed from Kraken).
- The pair could gain bullish momentum if there is a close above the $28,500 resistance.
Bitcoin Price Eyes More Gains
Bitcoin price made another attempt to clear the $28,500 resistance zone. However, BTC struggled to gain pace for a close above the $28,500 resistance zone.
As a result, there was a downside correction below the $28,000 level. The price spiked below the 50% Fib retracement level of the upward move from the $23,912 swing low to $28,591 high. It tested the key $27,400 support zone and the 100 hourly simple moving average.
The bulls protected the 61.8% Fib retracement level of the upward move from the $23,912 swing low to $28,591 high. There is also a key bullish trend line forming with support near $27,780 on the hourly chart of the BTC/USD pair.
Bitcoin price is now trading above $27,500 and the 100 hourly simple moving average. On the upside, an immediate resistance is near the $28,400 level.
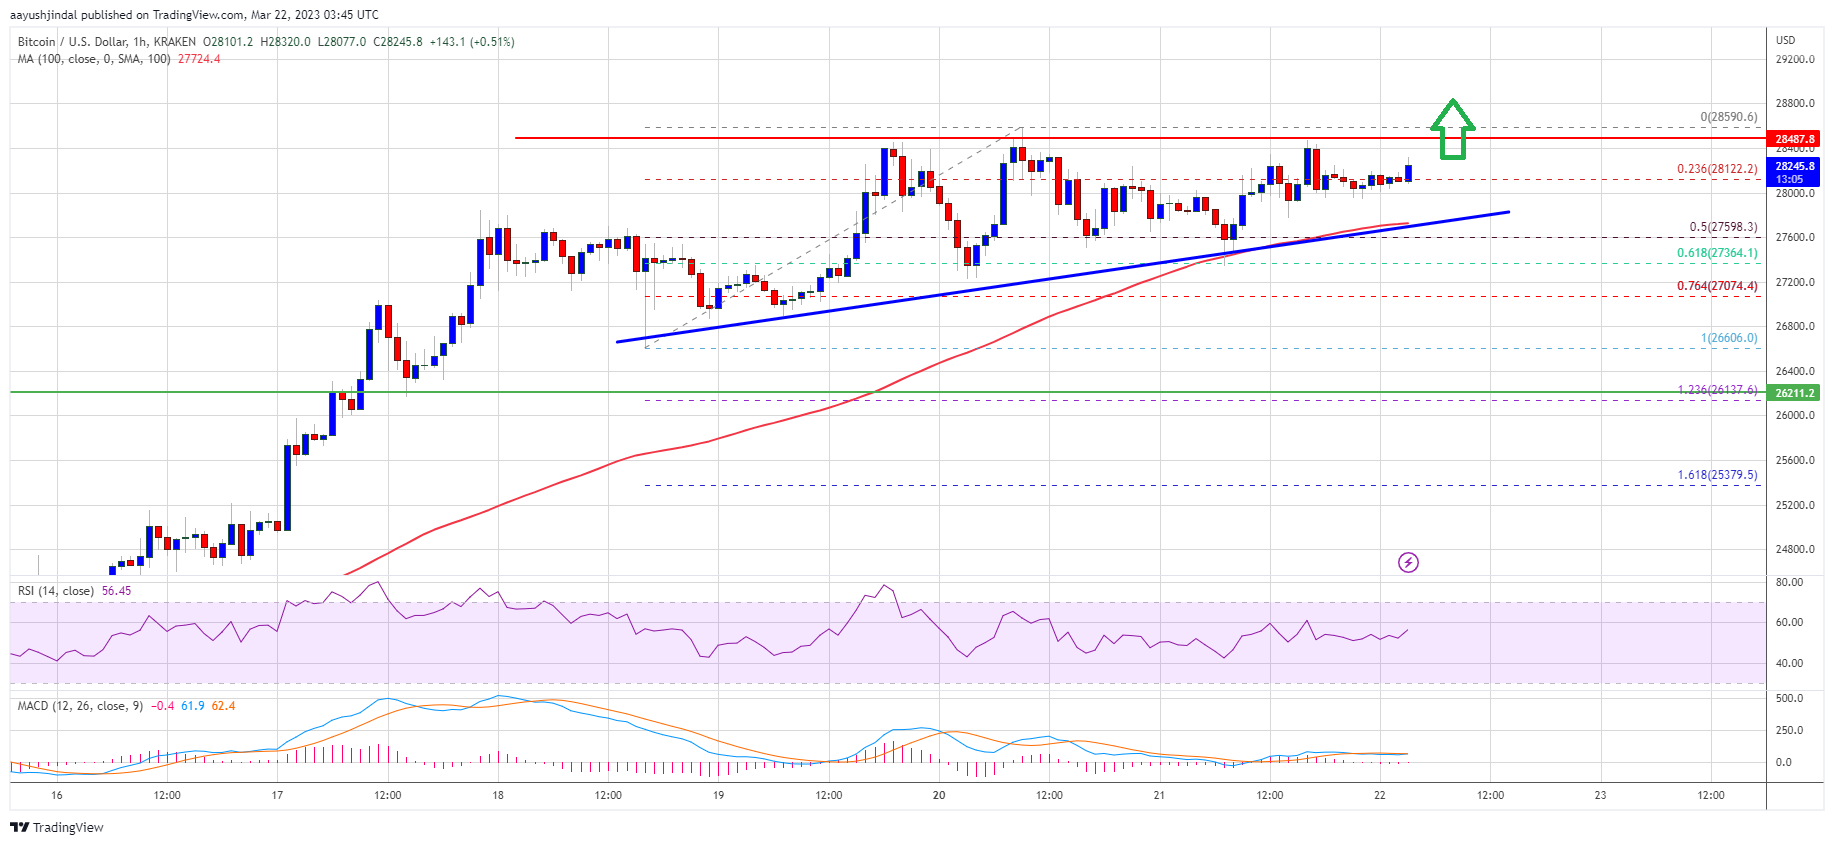
Source: BTCUSD on TradingView.com
The next major resistance is near the $28,500 zone or the recent high. A close above the $28,500 resistance might start another major increase. In the stated case, the price could rise towards the $29,200 level. Any more gains might send the price towards the $30,000 resistance zone.
Dips Limited in BTC?
If bitcoin price fails to clear the $28,500 resistance, it could start a downside correction. An immediate support on the downside is near the $27,780 zone, the 100 hourly simple moving average, and the trend line.
The next major support is near the $27,000 zone. Any more losses might send the price towards the $26,200 support zone. The next major support is near the $25,700 level.
Technical indicators:
Hourly MACD – The MACD is now gaining pace in the bullish zone.
Hourly RSI (Relative Strength Index) – The RSI for BTC/USD is now above the 50 level.
Major Support Levels – $27,780, followed by $27,000.
Major Resistance Levels – $28,400, $28,500 and $30,000.
Read bitcoin news daily on NewsBTC.com[/vc_column_text][/vc_column][/vc_row]