
Reason to trust
How Our News is Made
Strict editorial policy that focuses on accuracy, relevance, and impartiality
Ad discliamer
Morbi pretium leo et nisl aliquam mollis. Quisque arcu lorem, ultricies quis pellentesque nec, ullamcorper eu odio.
Bitcoin price started a steady increase above the $47,000 resistance against the US Dollar. BTC even broke $48,000 and it might continue to rise in the near term.
- Bitcoin started a steady increase above the $46,000 and $47,000 resistance levels.
- The price is now trading above $47,000 and the 100 hourly simple moving average.
- There is a key bullish trend line forming with support near $48,000 on the hourly chart of the BTC/USD pair (data feed from Kraken).
- The pair could accelerate higher towards the $50,000 level if it breaks the $48,500 resistance.
Bitcoin Price Gains Traction
Bitcoin price started a steady increase above the $46,000 resistance level. BTC was able to clear the $47,000 resistance zone and the 100 hourly simple moving average.
Finally, there was a clear break above the $48,000 resistance zone. The price traded as high as $48,481 and it is now consolidating gains. An immediate support on the downside is near the $48,000 level. There is also a key bullish trend line forming with support near $48,000 on the hourly chart of the BTC/USD pair.
Bitcoin is also trading well above the 23.6% Fib retracement level of the upward wave from the $43,375 swing low to $48,481 high. An immediate resistance on the upside is near the $48,200 level.
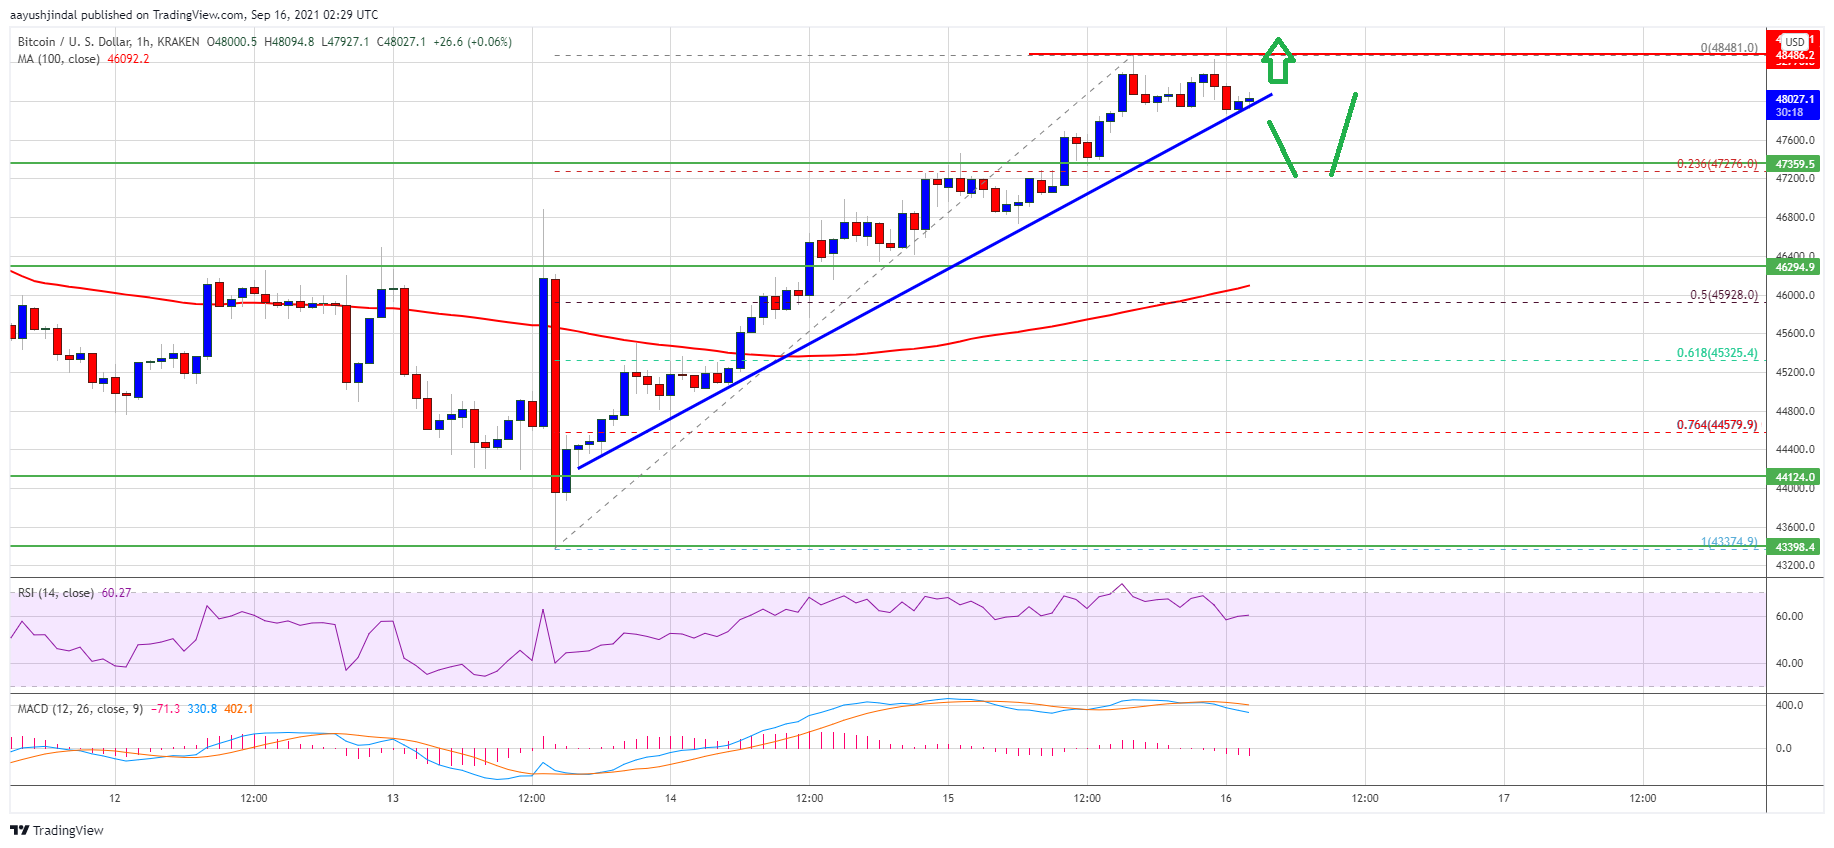
Source: BTCUSD on TradingView.com
The first major resistance is now near the $48,500 zone. To continue higher, bitcoin must clear the $48,500 resistance. If the bulls succeed, the price could easily rise towards the key $50,000 resistance in the near term. Any more gains may possibly set the pace for a move towards the $52,000 level.
Dips Supported In BTC?
If bitcoin fails to clear the $48,500 resistance zone, it could start a downside correction. An immediate support on the downside is near the $48,000 level and the trend line.
If the price breaks the trend line support, it could test the $47,400 support level. The next major support is near the $46,000 level or the 100 hourly simple moving average. It is also close to the 50% Fib retracement level of the upward wave from the $43,375 swing low to $48,481 high.
Technical indicators:
Hourly MACD – The MACD is slowly gaining pace in the bearish zone.
Hourly RSI (Relative Strength Index) – The RSI for BTC/USD is now well above the 50 level.
Major Support Levels – $47,500, followed by $47,000.
Major Resistance Levels – $48,200, $48,500 and $50,000.