
Reason to trust
How Our News is Made
Strict editorial policy that focuses on accuracy, relevance, and impartiality
Ad discliamer
Morbi pretium leo et nisl aliquam mollis. Quisque arcu lorem, ultricies quis pellentesque nec, ullamcorper eu odio.
Bitcoin price failed to settle above the $50,000 pivot zone against the US Dollar. BTC is now showing bearish signs and it seems like it could even decline below the $45,000 support.
- Bitcoin started a fresh decline after it failed to clear the $51,500 and $52,000 resistance levels.
- The price is now trading well below the $50,000 level and the 100 hourly simple moving average.
- There was a break below a key bullish trend line with support at $49,800 on the hourly chart of the BTC/USD pair (data feed from Kraken).
- The pair could move down further towards $45,000 or even $42,000 if it remains in the red zone.
Bitcoin Price is Showing Bearish Signs
After a clear break above the $50,000 level, bitcoin recovered further above $51,000. However, BTC faced a strong selling interest near the $52,000 level (as discussed in the last two analysis).
The price also topped near the 100 hourly simple moving average at $52,000. There was a fresh bearish wave below the $50,000 support zone. The bears gained strength, resulting in a break below a key bullish trend line with support at $49,800 on the hourly chart of the BTC/USD pair.
The pair even broke the $47,000 support and traded as low as $46,228. It is currently consolidating losses near the $47,000 level. An initial resistance on the upside is near the $47,500 level. The first major resistance is near the $49,150 level. It is close to the 50% Fib retracement level of the recent decline from the $52,088 high to $46,228 low.
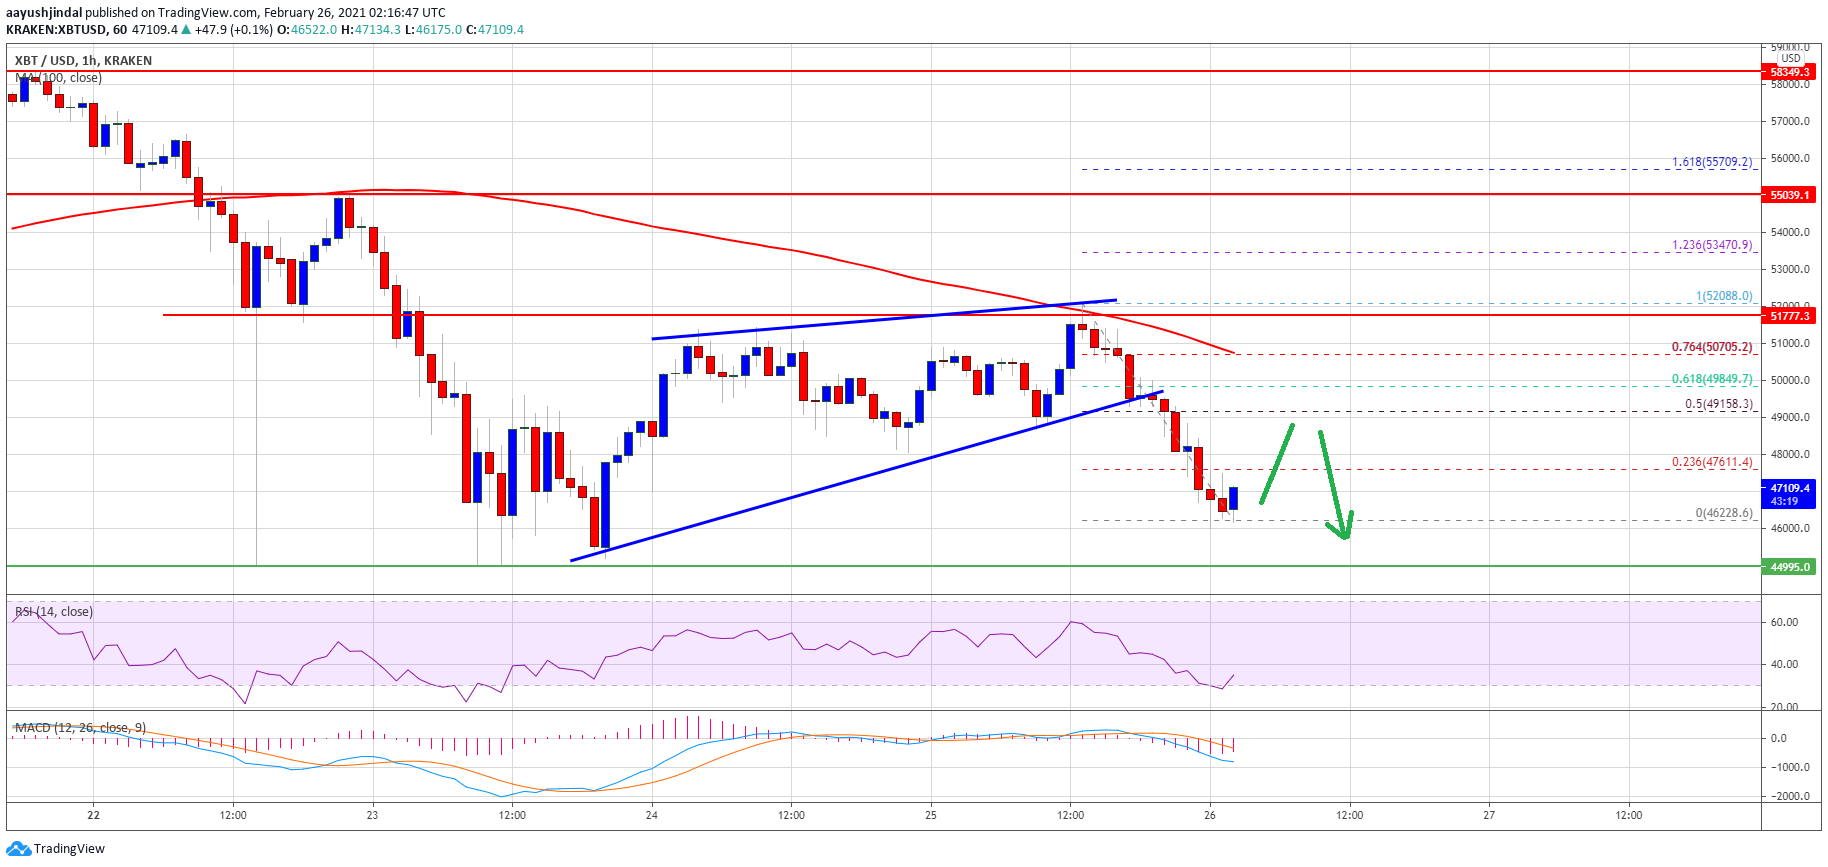
Source: BTCUSD on TradingView.com
The main resistance is now forming near the $50,700 level and the 100 hourly simple moving average. It is close to the 76.4% Fib retracement level of the recent decline from the $52,088 high to $46,228 low.
A close above the $50,000 level and a follow up move above the $50,700 level may possibly open the doors for a break of the $52,000 resistance zone.
More Losses in BTC?
If bitcoin fails to continue higher above the $49,500 and $50,000 resistance levels, there could be more losses. An initial support on the downside is near the $46,200 level.
The first major support is still near the $45,000 zone. If there is a clear break below the $45,000 support, the price could dive towards the $42,000 support zone.
Technical indicators:
Hourly MACD – The MACD is slowly gaining momentum in the bearish zone.
Hourly RSI (Relative Strength Index) – The RSI for BTC/USD is well below the 50 level.
Major Support Levels – $46,200, followed by $45,000.
Major Resistance Levels – $49,150, $50,000 and $50,700.