Reason to trust
How Our News is Made
Strict editorial policy that focuses on accuracy, relevance, and impartiality
Ad discliamer
Morbi pretium leo et nisl aliquam mollis. Quisque arcu lorem, ultricies quis pellentesque nec, ullamcorper eu odio.
Bitcoin price is attempting a fresh increase above the $21,200 resistance zone. BTC could gain bullish momentum if there is a clear move above the $21,500 resistance.
- Bitcoin corrected lower, but it found support near the $20,500 zones.
- The price is trading above $21,000 and the 100 hourly simple moving average.
- There is a short-term key bullish trend line forming with support near $21,050 on the hourly chart of the BTC/USD pair (data feed from Kraken).
- The pair could start a fresh increase if there is a clear move above the $21,500 resistance zone.
Bitcoin Price Remains Supported
Bitcoin price started a downside correction from the $21,500 resistance zone. BTC declined below the $21,000 support zone, similar to ethereum.
However, the bulls were active near the $20,500 and $20,400 support levels. A low is formed near $20,395 and the price is now rising. There was a clear move above the $20,850 resistance zone. The bulls pushed the price above the 50% Fib retracement level of the recent decline from the $21,639 swing high to $20,395 low.
Bitcoin price is now trading above $21,000 and the 100 hourly simple moving average. There is also a short-term key bullish trend line forming with support near $21,050 on the hourly chart of the BTC/USD pair.
An immediate resistance is near the $21,160 level. It is near the 61.8% Fib retracement level of the recent decline from the $21,639 swing high to $20,395. The next major resistance is near the $21,500 zone, above which the price might gain bullish momentum.
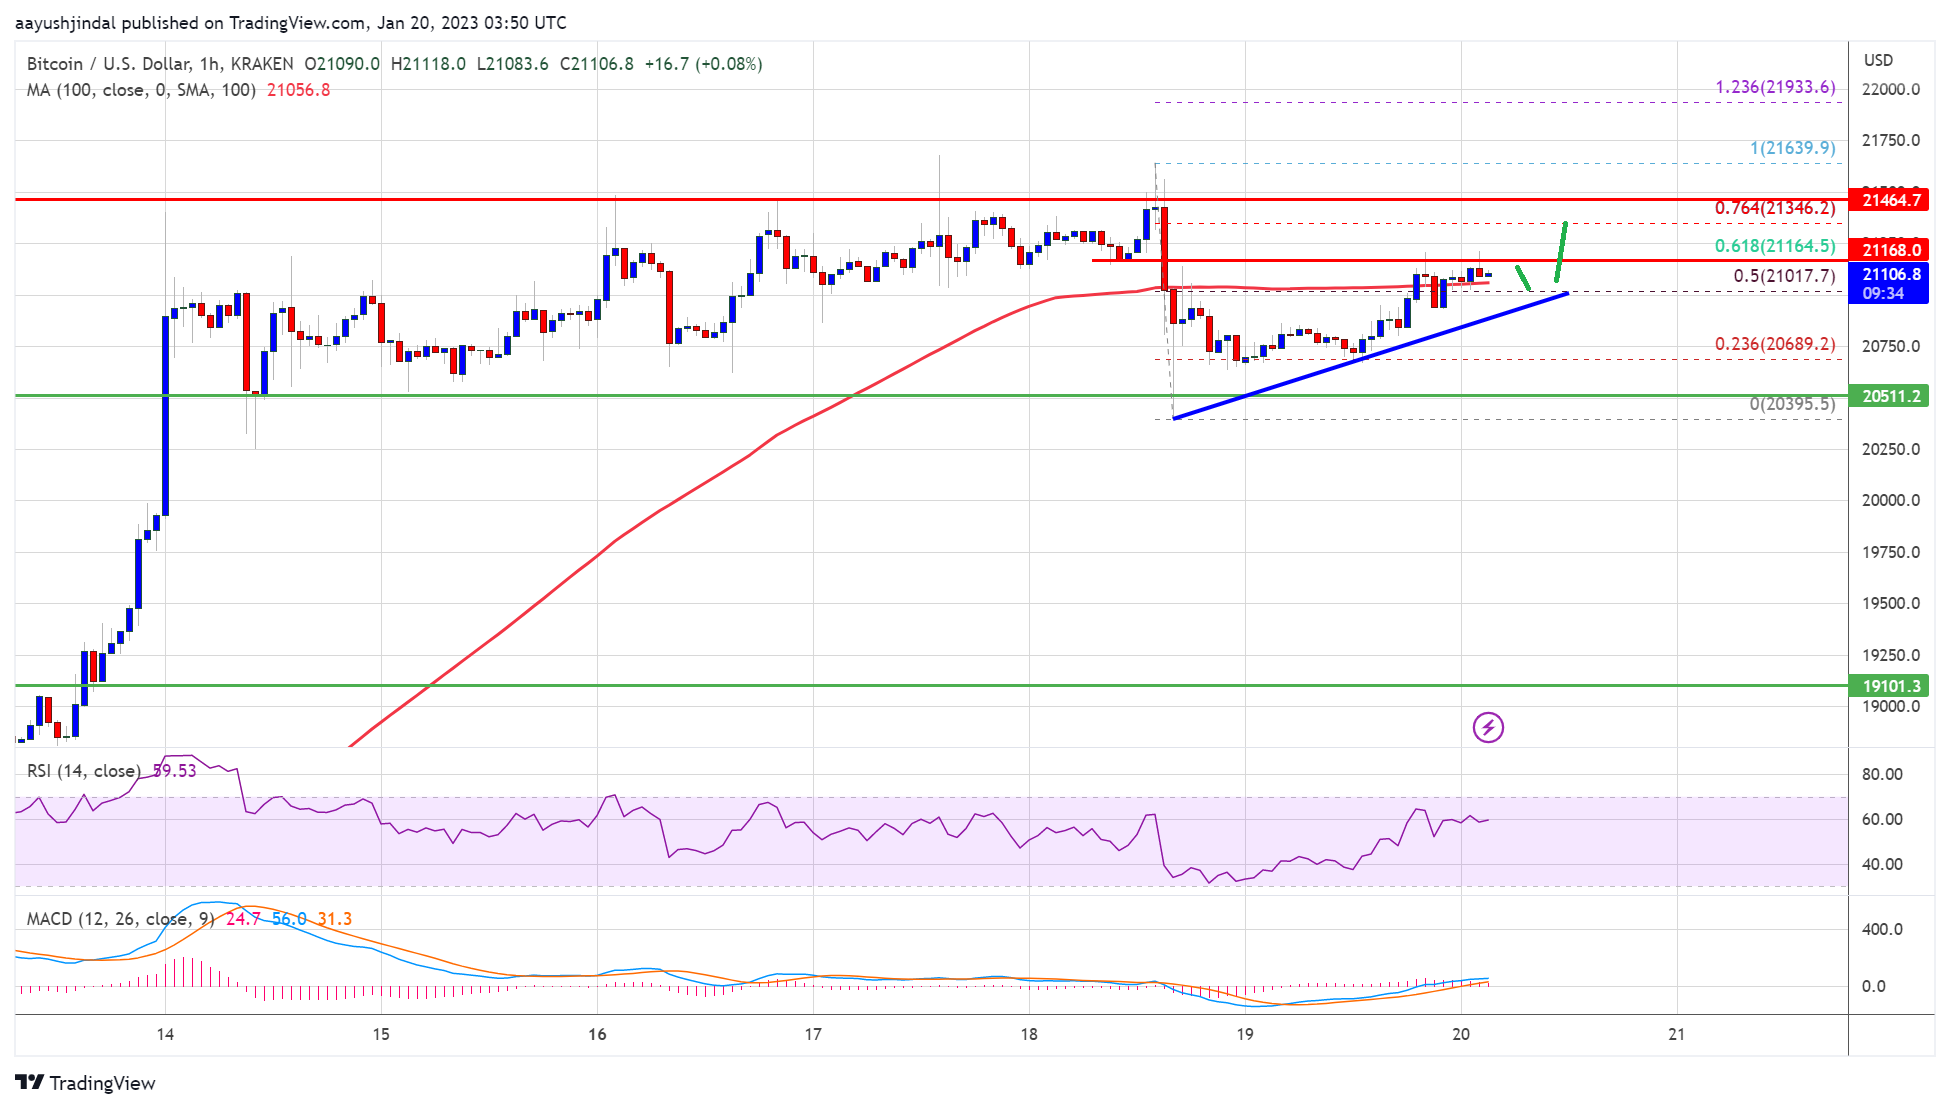
Source: BTCUSD on TradingView.com
In the stated case, the price may perhaps rise towards the $22,000 level. Any more gains might send btc price towards the $22,500 level.
Another Drop in BTC?
If bitcoin price fails to clear the $21,250 resistance, it could start a fresh decline. An immediate support on the downside is near the $21,050 zone and the trend line.
The next major support is near the $20,500 zone, below which the price might gain bearish momentum and test $20,000. Any more losses might send the price to $19,500 in the near term.
Technical indicators:
Hourly MACD – The MACD is now losing pace in the bearish zone.
Hourly RSI (Relative Strength Index) – The RSI for BTC/USD is now above the 50 level.
Major Support Levels – $20,500, followed by $20,000.
Major Resistance Levels – $21,160, $21,250 and $21,500.