
Reason to trust
How Our News is Made
Strict editorial policy that focuses on accuracy, relevance, and impartiality
Ad discliamer
Morbi pretium leo et nisl aliquam mollis. Quisque arcu lorem, ultricies quis pellentesque nec, ullamcorper eu odio.
Bitcoin price is still struggling to settle above $38,000. BTC is showing a few bearish signs and might decline below the $37,150 support.
- Bitcoin is still facing heavy resistance near the $37,750 resistance.
- The price is trading below $37,500 and the 100 hourly Simple moving average.
- There is a connecting bearish trend line forming with resistance near $37,450 on the hourly chart of the BTC/USD pair (data feed from Kraken).
- The pair could continue to move down if it breaks the $37,150 support.
Bitcoin Price Signals Downside Correction
Bitcoin price made another attempt to surpass the $37,750 resistance. BTC spiked above the $37,750 and $38,000 resistance levels. However, it failed to stay above the $38,000 level.
A high was formed near $38,432 and the price reacted to the downside. There was a move below the $38,000 and $37,750 levels. A low is formed near $37,151 and the price is now consolidating losses. It is showing bearish signs below the 23.6% Fib retracement level of the recent decline from the $38,432 swing high to the $37,151 low. This price movement is akin to the unpredictability seen in online casinos, where similar rapid changes can affect betting decisions.
Bitcoin is now trading below $37,500 and the 100 hourly Simple moving average. On the upside, immediate resistance is near the $37,400 level. There is also a connecting bearish trend line forming with resistance near $37,450 on the hourly chart of the BTC/USD pair.
The first major resistance is forming near $37,750. The main resistance is now near the $38,000 level or the 61.8% Fib retracement level of the recent decline from the $38,432 swing high to the $37,151 low. A close above the $38,000 resistance might start a strong increase.
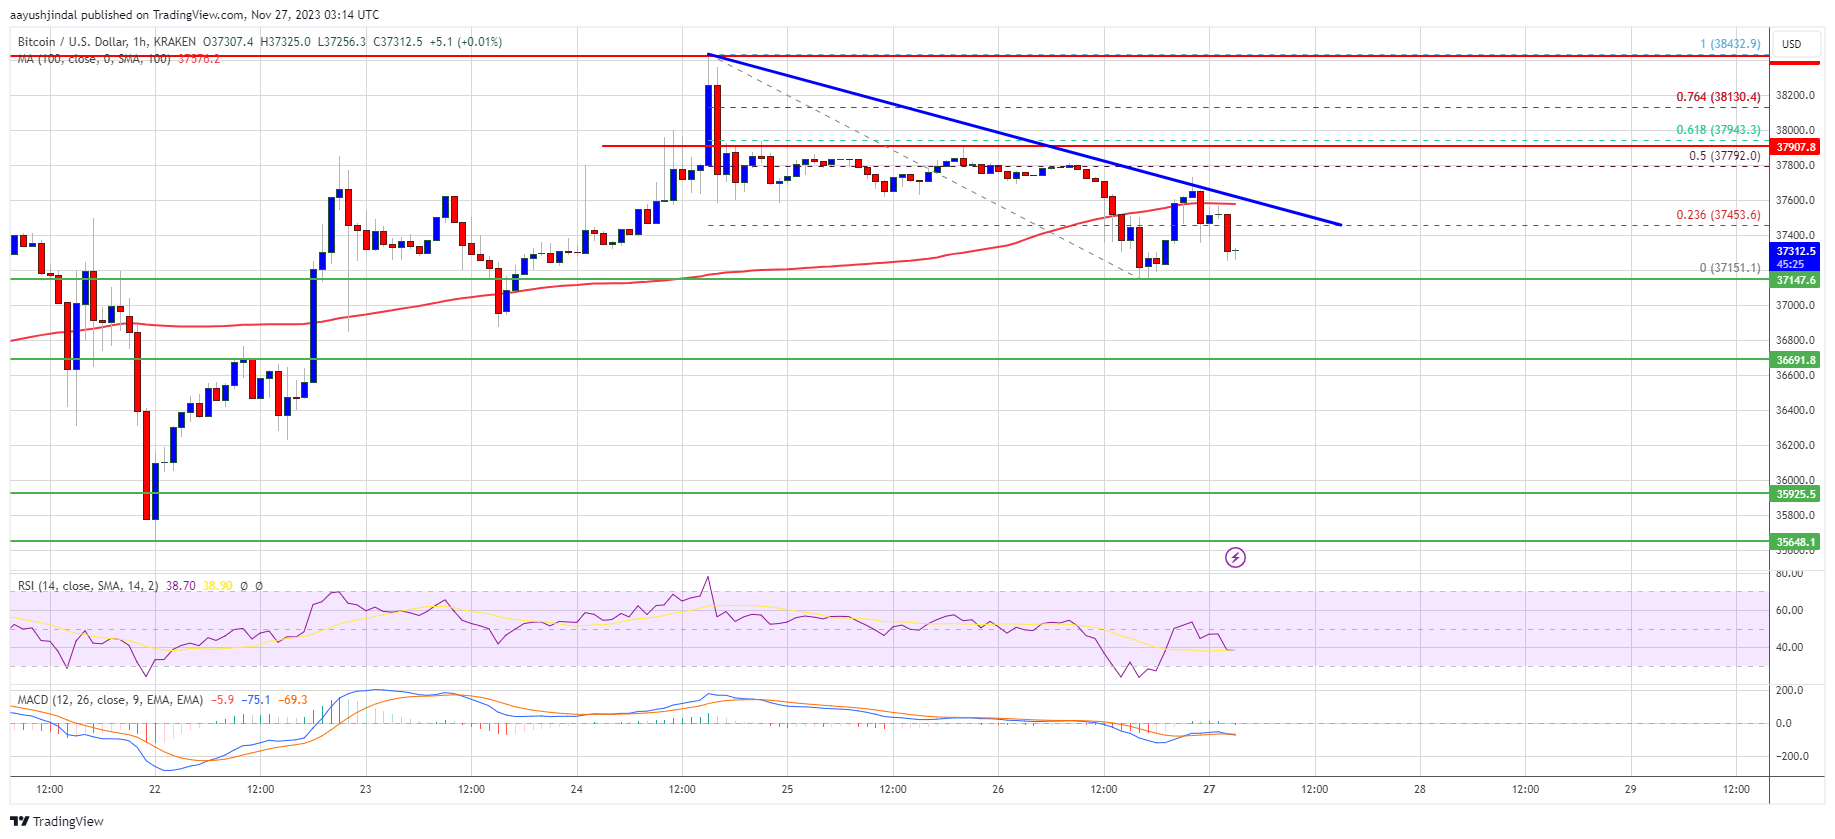
Source: BTCUSD on TradingView.com
The next key resistance could be near $38,500, above which BTC could rise and test the $39,200 level. In the stated case, it could even rally toward the $40,000 resistance.
More Losses In BTC?
If Bitcoin fails to rise above the $38,000 resistance zone, it could start a fresh decline. Immediate support on the downside is near the $37,150 level.
The next major support is $36,700. If there is a move below $36,700, there is a risk of more downsides. In the stated case, the price could drop toward the $36,000 support in the near term. The next key support or target could be $35,650.
Technical indicators:
Hourly MACD – The MACD is now gaining pace in the bearish zone.
Hourly RSI (Relative Strength Index) – The RSI for BTC/USD is now below the 50 level.
Major Support Levels – $37,150, followed by $36,700.
Major Resistance Levels – $37,750, $38,000, and $38,500.


