
Reason to trust
How Our News is Made
Strict editorial policy that focuses on accuracy, relevance, and impartiality
Ad discliamer
Morbi pretium leo et nisl aliquam mollis. Quisque arcu lorem, ultricies quis pellentesque nec, ullamcorper eu odio.
Bitcoin is showing positive signs above the $20,500 zone against the US Dollar. BTC could rally if there is a clear move above the $21,250 resistance zone.
- Bitcoin remains well supported above the $20,000 and $20,500 levels.
- The price is now above the $20,500 level and the 100 hourly simple moving average.
- There was a break above a major bearish trend line with resistance near $20,450 on the hourly chart of the BTC/USD pair (data feed from Kraken).
- The pair could gain bullish momentum if it clears the $21,250 and $21,650 resistance levels.
Bitcoin Price Could Gain Pace
Bitcoin price started a downside correction below the $20,500 level. There was also a move below the $20,000 level, but the price was stable near the $19,750 zone.
A low was formed near $19,750 and the price started fresh. BTC was able to clear the $20,000 and $20,500 resistance levels. Besides, there was a break above a major bearish trend line with resistance near $20,450 on the hourly chart of the BTC/USD pair.
The pair climbed above the 50% Fib retracement level of the downward move from the $21,698 swing high to $19,750 low. Bitcoin is now above the $20,500 level and the 100 hourly simple moving average.
An immediate resistance on the upside is near the $21,250 level. It is near the 76.4% Fib retracement level of the downward move from the $21,698 swing high to $19,750 low. The next key resistance is near the $21,650 level. A clear move above the $21,650 level might start a decent increase.
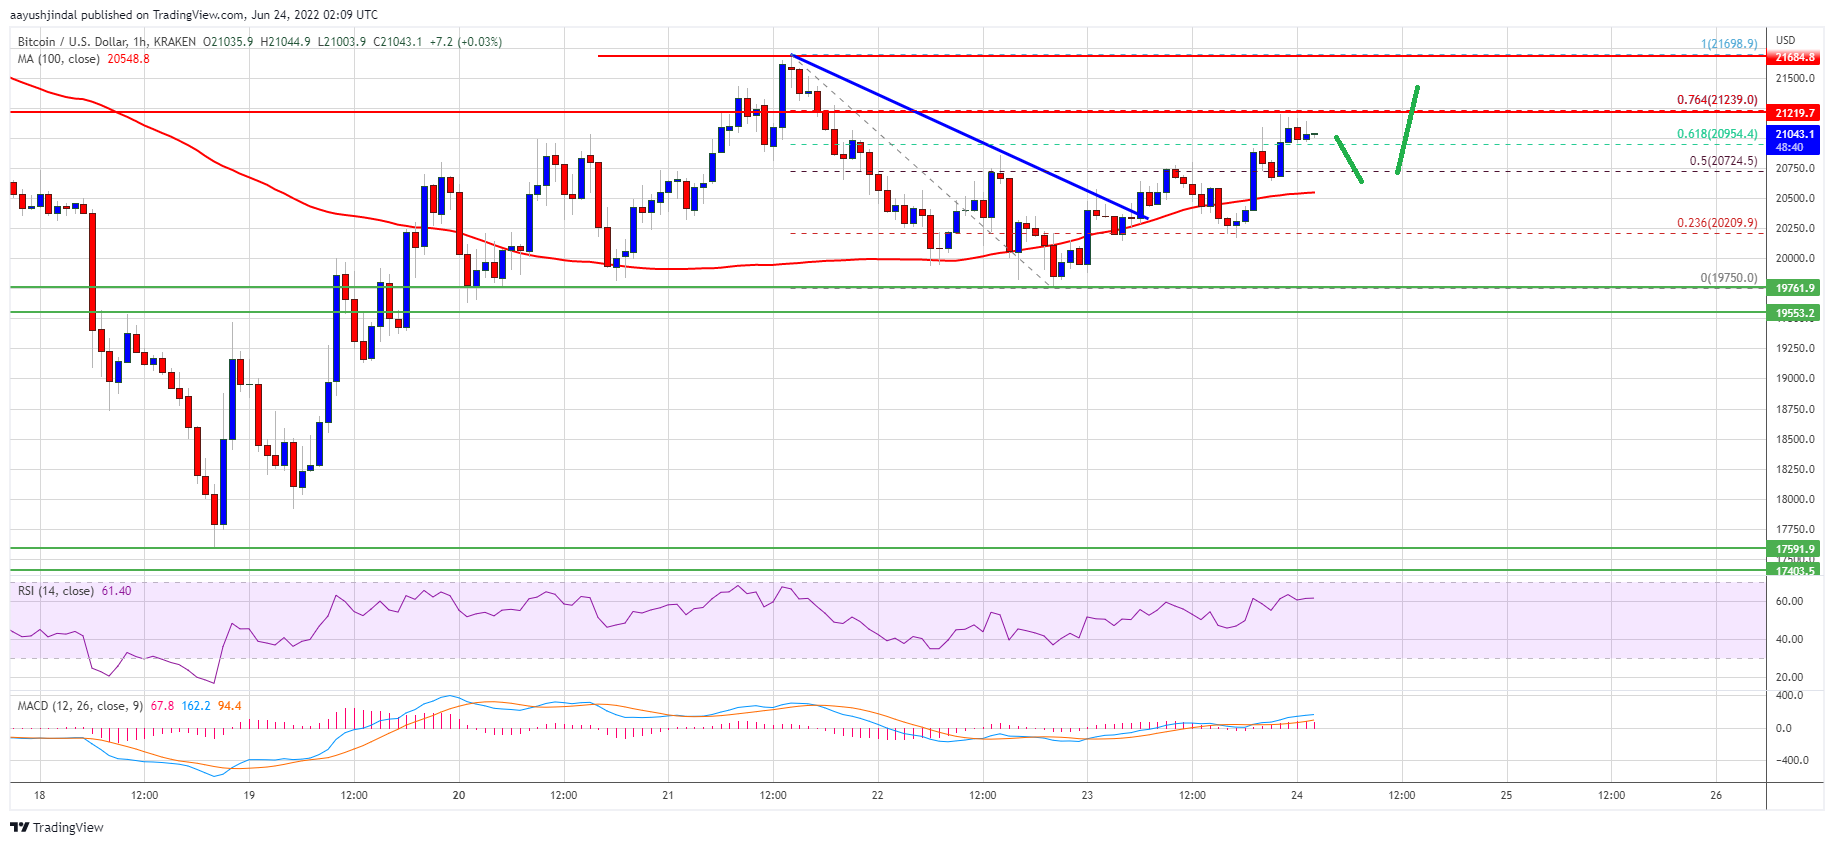
Source: BTCUSD on TradingView.com
The next major resistance sits near the $22,200 level, above which the bulls might gain strength for a move towards the $23,000 resistance zone.
Fresh Decline in BTC?
If bitcoin fails to clear the $21,250 resistance zone, it could start another decline. An immediate support on the downside is near the $20,600 level and the 100 hourly SMA.
The first major support is near the $20,000 level. The main support is now near the $19,750 level. A downside break below the $19,750 support could put a lot of pressure on the bulls in the near term. In the stated case, the price might slide towards the $18,500 level.
Technical indicators:
Hourly MACD – The MACD is now gaining pace in the bullish zone.
Hourly RSI (Relative Strength Index) – The RSI for BTC/USD is now above the 50 level.
Major Support Levels – $20,600, followed by $20,000.
Major Resistance Levels – $21,250, $21,650 and $23,000.