
Reason to trust
How Our News is Made
Strict editorial policy that focuses on accuracy, relevance, and impartiality
Ad discliamer
Morbi pretium leo et nisl aliquam mollis. Quisque arcu lorem, ultricies quis pellentesque nec, ullamcorper eu odio.
Bitcoin price surged above the $28,000 resistance zone. BTC is correcting gains, but dips might be limited below the $26,200 support zone.
- Bitcoin is up over 20% in a few days and there was a move above the $28,000 resistance.
- The price is trading above $27,000 and the 100 hourly simple moving average.
- There is a key bullish trend line forming with support near $27,100 on the hourly chart of the BTC/USD pair (data feed from Kraken).
- The pair could rally further if it stays above the $26,200 support zone.
Bitcoin Price Extends Rally
Bitcoin price remained well bid above the $25,000 support zone. BTC started another steady increase and was able to clear the $26,500 resistance zone, outperforming altcoins such as Ethereum and Ripple.
There was a clear move above the $27,500 and $28,000 resistance levels. The price traded to a new multi-week high at $28,450 and is currently correcting gains. There was a minor downside correction below the $28,200 and $28,000 levels.
Bitcoin price is now trading above $27,000 and the 100 hourly simple moving average. It is also well above the 23.6% Fib retracement level of the upward move from the $23,913 swing low to $28,450 high.
Besides, there is a key bullish trend line forming with support near $27,100 on the hourly chart of the BTC/USD pair. On the upside, an immediate resistance is near the $28,000 level. The next major resistance is near the $28,500 zone or the recent high.
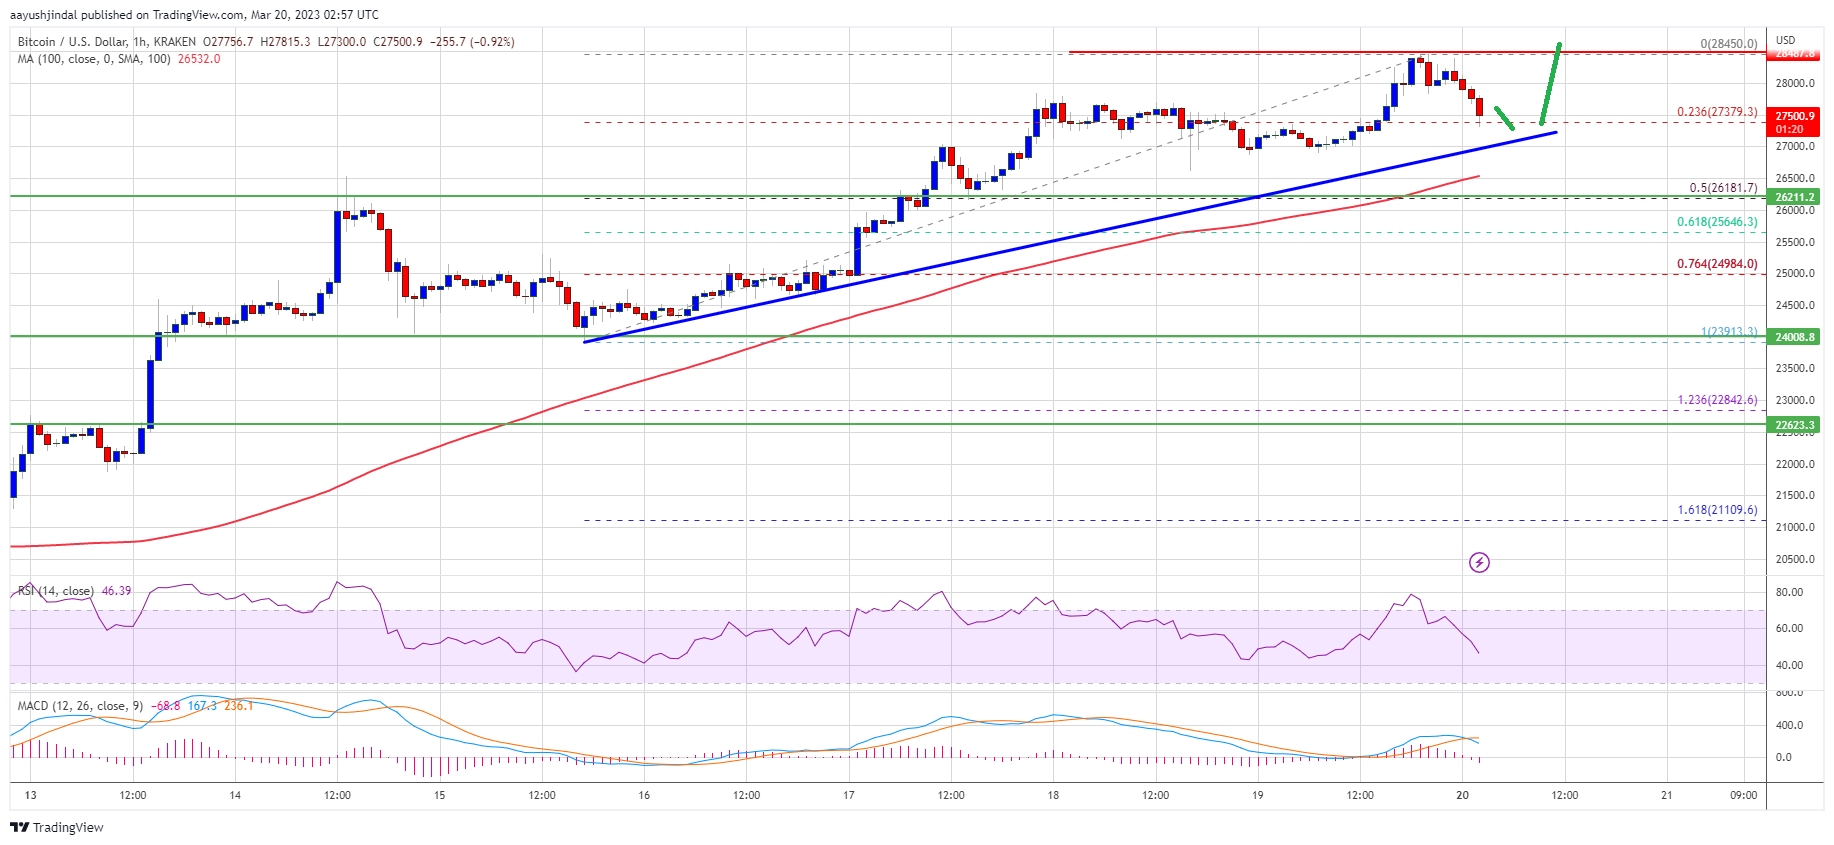
Source: BTCUSD on TradingView.com
A close above the $28,500 resistance might start another surge. In the stated case, the price could rally towards the $29,500 level. The next key resistance is near the $29,800 zone, above which the price might test the $30,000 barrier.
Dips Supported in BTC?
If bitcoin price fails to clear the $28,500 resistance, it could start a downside correction. An immediate support on the downside is near the $27,400 zone.
The next major support is near the trend line and $27,000, below which the price even test the 100 hourly simple moving average. The next major support is near the $26,200 level. Any more losses might send the price towards the $25,000 level.
Technical indicators:
Hourly MACD – The MACD is now losing pace in the bullish zone.
Hourly RSI (Relative Strength Index) – The RSI for BTC/USD is now below the 50 level.
Major Support Levels – $27,200, followed by $26,200.
Major Resistance Levels – $28,000, $28,500 and $30,000.