
Reason to trust
How Our News is Made
Strict editorial policy that focuses on accuracy, relevance, and impartiality
Ad discliamer
Morbi pretium leo et nisl aliquam mollis. Quisque arcu lorem, ultricies quis pellentesque nec, ullamcorper eu odio.
Bitcoin price extended its decline and tested the $55,500 support against the US Dollar. BTC is now recovering, but it is likely to face a strong resistance near the $57,500 level.
- Bitcoin failed to hold the $57,000 zone and extended its decline towards the $55,500 level.
- The price is now trading well below the $57,500 support and the 100 hourly simple moving average.
- There was a break below a key contracting triangle with support near $57,450 on the hourly chart of the BTC/USD pair (data feed from Kraken).
- The pair could correct higher, but the bulls are likely to face a strong selling interest near $57,500.
Bitcoin Price Dips Further
Bitcoin struggled to restart its upward move above the $58,000 zone, resulting in a bearish move. BTC broke the $57,500 and $56,200 support levels to move further into a bearish zone.
There was also a break below a key contracting triangle with support near $57,450 on the hourly chart of the BTC/USD pair. The pair spiked below the $56,000 level and tested the next key support near the $55,500 zone.
A low is formed near $55,492 and the price is consolidating losses. It is now trading above $56,000, and testing the 23.6% Fib retracement level of the recent drop from the $59,475 swing high to $55,492 low. On the upside, the first key resistance is near the $57,000 level.
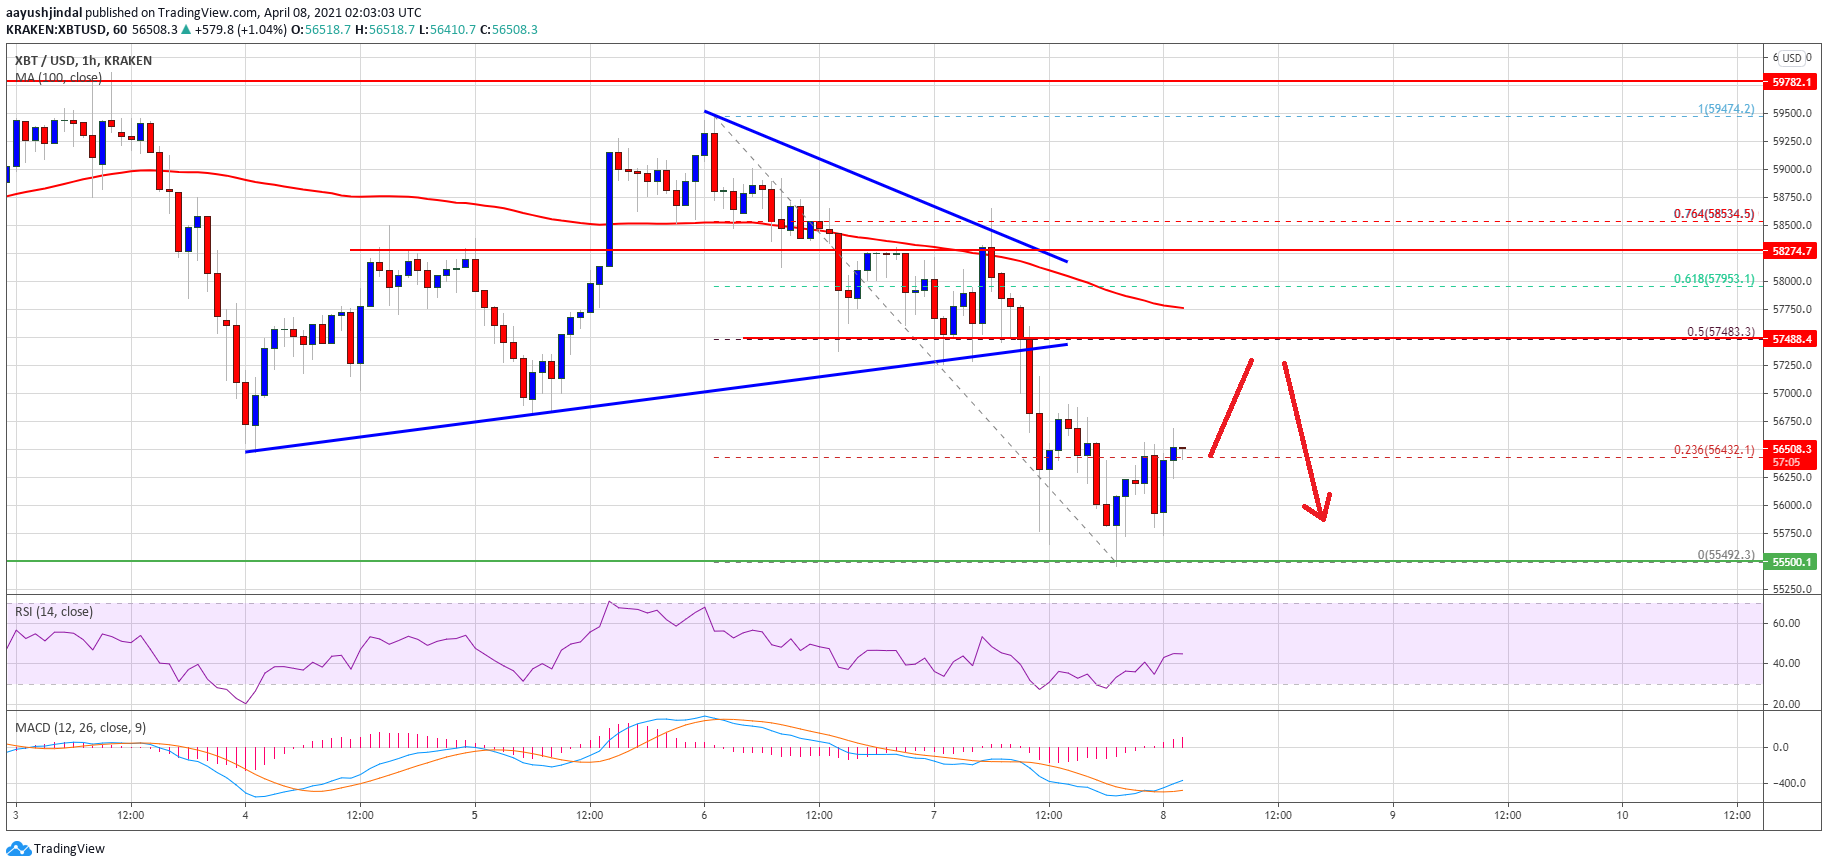
Source: BTCUSD on TradingView.com
The main resistance is now forming near the $57,500 level (the recent breakdown zone). The 50% Fib retracement level of the recent drop from the $59,475 swing high to $55,492 low is also near the $57,500 level to act as a massive hurdle. A clear break above the $57,500 level could open the doors for a steady increase.
More Losses in BTC?
If bitcoin fails to climb above $57,000 and $57,500, there could be more downsides. The first major support on the downside is near the $56,000 level.
The main support is now forming near the $55,500 level. A downside break below the recent low and $55,500 could accelerate losses. The next target for the bears might be $53,200 or even $52,500 in the near term.
Technical indicators:
Hourly MACD – The MACD is slowly losing momentum in the bearish zone.
Hourly RSI (Relative Strength Index) – The RSI for BTC/USD is still well below the 50 level.
Major Support Levels – $56,000, followed by $55,500.
Major Resistance Levels – $57,000, $57,500 and $58,000.