
Reason to trust
How Our News is Made
Strict editorial policy that focuses on accuracy, relevance, and impartiality
Ad discliamer
Morbi pretium leo et nisl aliquam mollis. Quisque arcu lorem, ultricies quis pellentesque nec, ullamcorper eu odio.
Bitcoin price remained in a bullish zone above the $45,000 support against the US Dollar. BTC is eyeing a fresh rally above the $48,000 and $50,000 resistance levels in the near term.
- Bitcoin climbed above the $48,000 resistance, but it struggled to continue higher towards $50,000.
- The price is trading nicely above the $45,000 level and the 100 simple moving average (4-hours).
- There is a major bullish trend line forming with support near $46,000 on the 4-hours chart of the BTC/USD pair (data feed from Kraken).
- The pair could start a strong rally if it manages to clear the $48,000 and $48,500 resistance levels.
Bitcoin Price is Eyeing More Upsides
This past week, bitcoin price made an attempt to test the $50,000 level against the US Dollar. The BTC/USD pair broke the $48,000 resistance, but there was a lack in momentum.
A new all-time high was formed near $48,700 before the price started a downside correction. There was a break below the $47,000 support. The price traded below the 23.6% Fib retracement level of the upward move from the $43,773 swing low to $48,700 high.
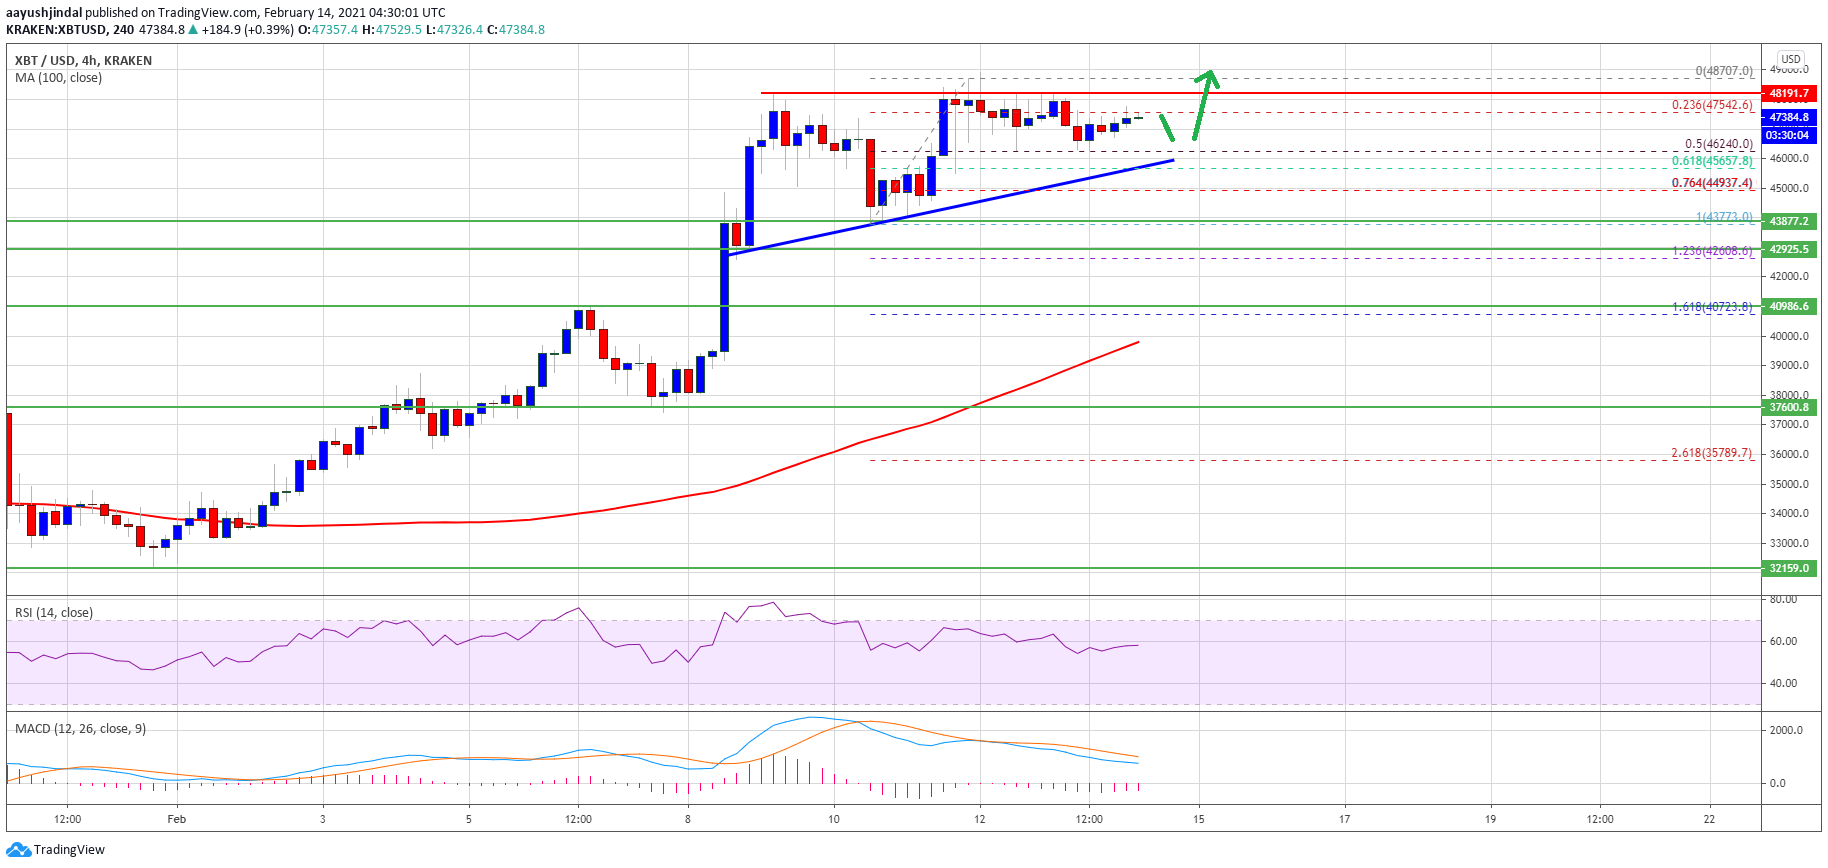
Source: BTCUSD on TradingView.com
Bitcoin price is now trading nicely above the $45,000 level and the 100 simple moving average (4-hours). On the downside, there is a decent support forming near the $46,000 level.
There is also a major bullish trend line forming with support near $46,000 on the 4-hours chart of the BTC/USD pair. The trend line is close to the 50% Fib retracement level of the upward move from the $43,773 swing low to $48,700 high.
On the upside, the $48,000 and $48,500 levels are important hurdles. A clear break above the $48,000 level is likely to increase the chances of a surge above the $50,000 level in the coming sessions.
Dips Supported in BTC?
If bitcoin struggles to clear the $48,000 resistance level, there are chances of a downside correction. The first major support is near the trend line and $46,000.
The next major support is near the $45,000 level. If there is a clear break and close below the $45,000 support, the price could decline 5%-10%. The next major support on the downside is near the $41,000 level.
Technical indicators
4 hours MACD – The MACD for BTC/USD is likely to gain strength in the bullish zone.
4 hours RSI (Relative Strength Index) – The RSI for BTC/USD is still above the 50 level.
Major Support Level – $46,000
Major Resistance Level – $48,000