
Reason to trust
How Our News is Made
Strict editorial policy that focuses on accuracy, relevance, and impartiality
Ad discliamer
Morbi pretium leo et nisl aliquam mollis. Quisque arcu lorem, ultricies quis pellentesque nec, ullamcorper eu odio.
Bitcoin price started a fresh decline after it failed to clear $52,000 against the US Dollar. BTC is sliding and it remains at a risk of a drop towards $41,000.
- Bitcoin recovered above $50,000, but it struggled to clear the $52,000 resistance.
- The price is trading well below $50,000 and the 100 simple moving average (4-hours).
- There is a key declining channel forming with resistance near $49,220 on the 4-hours chart of the BTC/USD pair (data feed from Kraken).
- The pair is likely to continue lower towards the $41,000 and $40,000 support levels in the near term.
Bitcoin Price is Showing Bearish Signs
This past week, bitcoin price extended its decline below the $47,000 support zone against the US Dollar. The BTC/USD pair even tested the $44,000 support zone and settled well below the 100 simple moving average (4-hours).
The last rejection zone was near the $52,000 level before the price declined below $45,000. It traded as low $44,360 before correcting higher. It recovered above the 23.6% Fib retracement level of the downward move from the $52,229 high to $44,360 low.
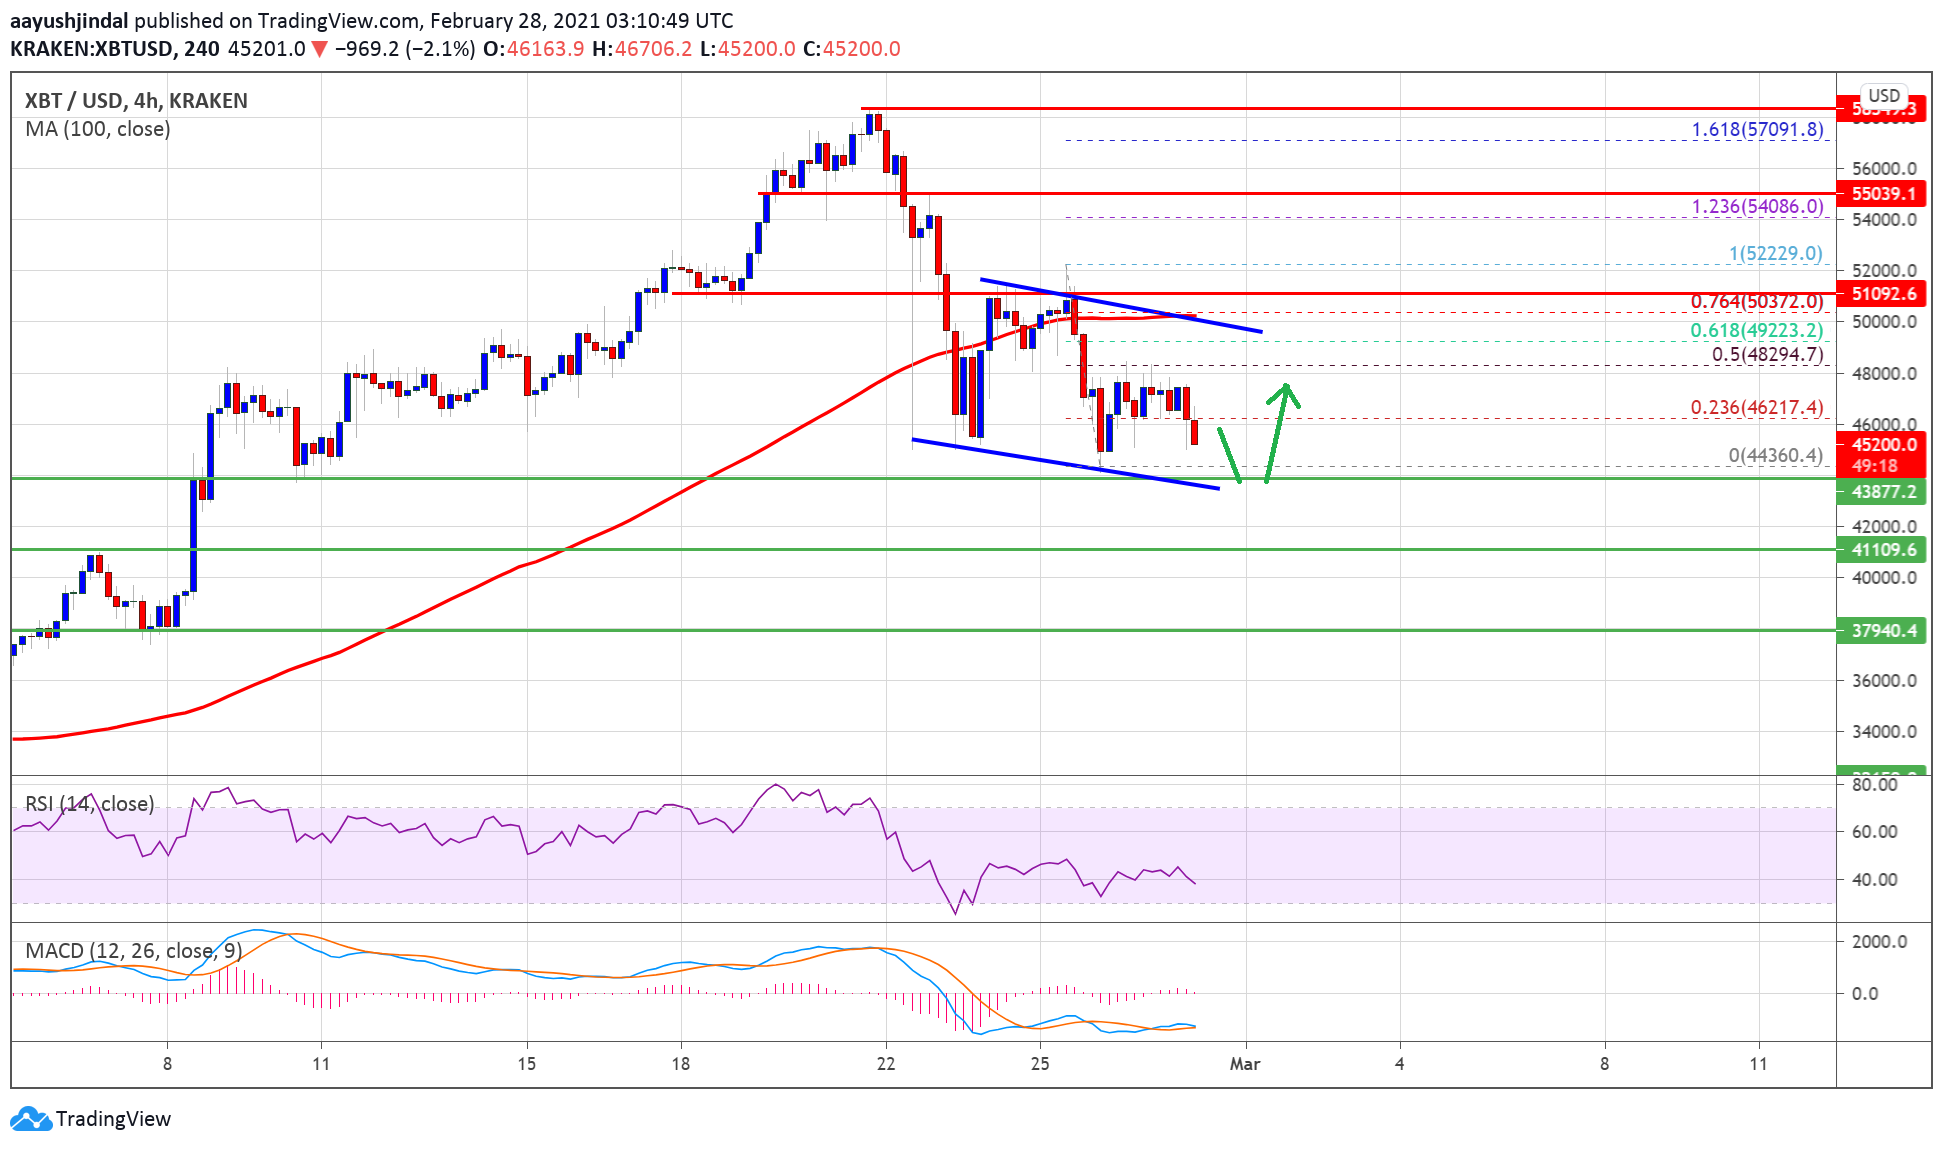
Source: BTCUSD on TradingView.com
However, the price struggled to clear the $48,000 resistance zone. It also failed to surpass the 50% Fib retracement level of the downward move from the $52,229 high to $44,360 low.
There is also a key declining channel forming with resistance near $49,220 on the 4-hours chart of the BTC/USD pair. Bitcoin is currently moving lower and it is likely to test the $44,000 support zone. If there is a downside break below the $44,000 support zone, there are chances of more downsides towards the $41,000 support zone. The next major support is near the $40,000 level.
Upsides Capped in BTC?
If bitcoin starts a fresh increase, the first key resistance is near the $48,000 level. The main resistance is now forming near the channel upper trend line and $50,000.
A clear break above the channel resistance could open the doors for decent increase above $50,000. The next key resistance is near the $52,000 level, above which the price might rise towards the $55,000 level.
Technical indicators
4 hours MACD – The MACD for BTC/USD is showing negative signs in the bearish zone.
4 hours RSI (Relative Strength Index) – The RSI for BTC/USD is now well below the 50 level.
Major Support Level – $44,000
Major Resistance Level – $50,000


