
Reason to trust
How Our News is Made
Strict editorial policy that focuses on accuracy, relevance, and impartiality
Ad discliamer
Morbi pretium leo et nisl aliquam mollis. Quisque arcu lorem, ultricies quis pellentesque nec, ullamcorper eu odio.
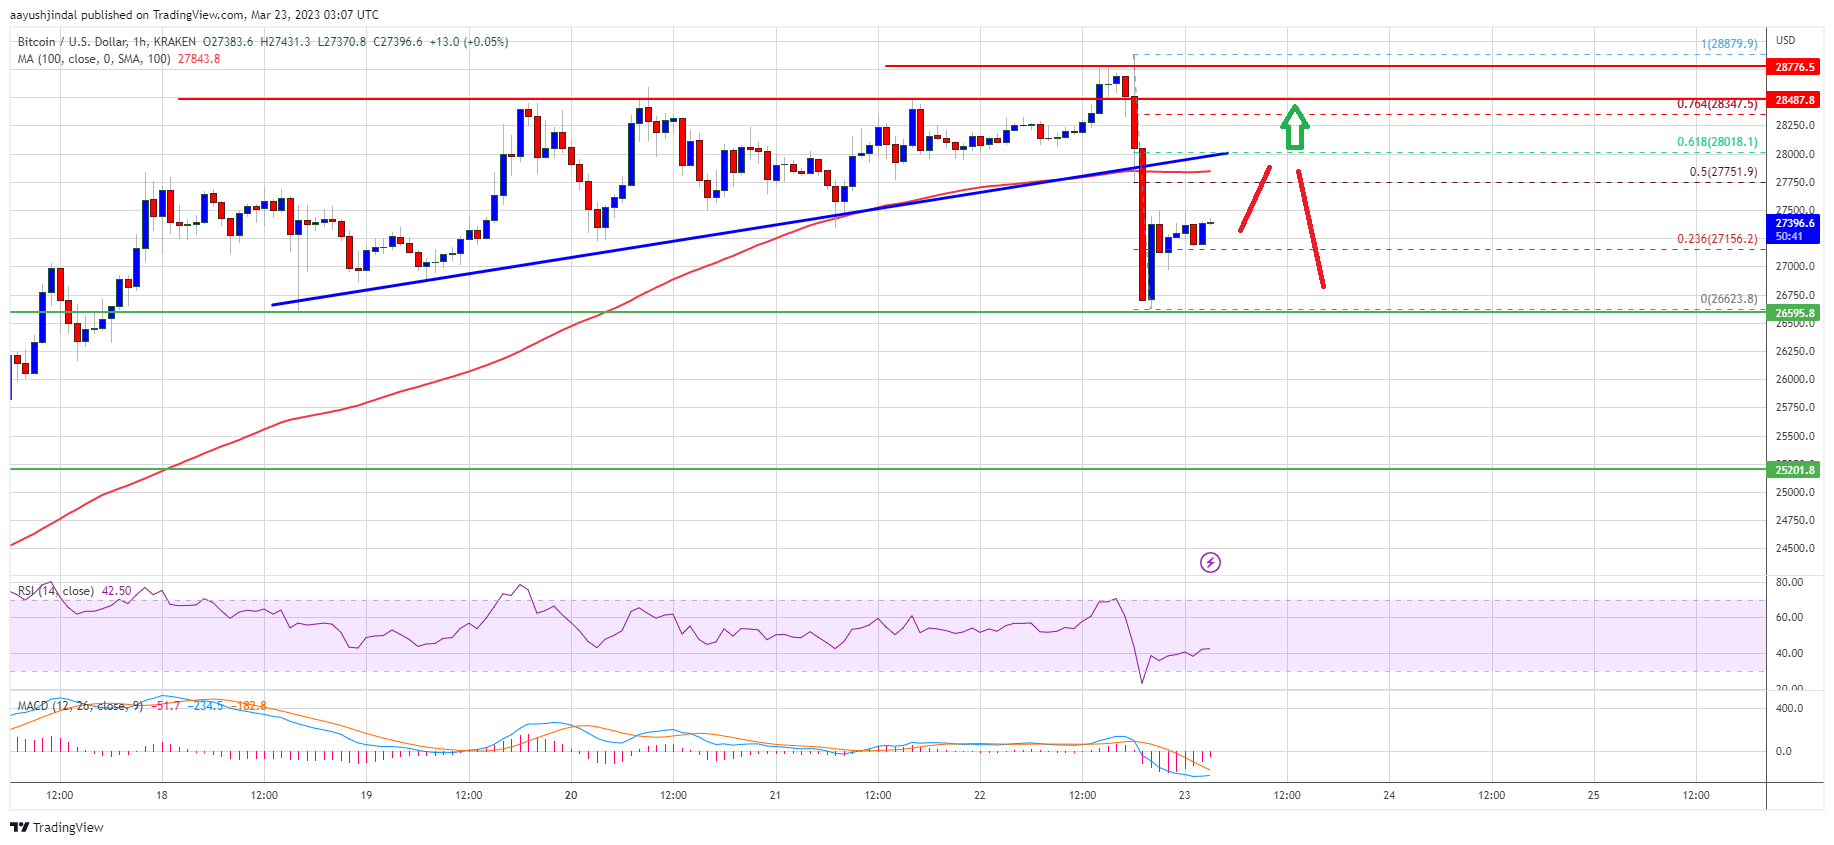
Bitcoin price started a downside correction from the $28,500 resistance zone. BTC found support near $26,600 and is currently attempting a fresh increase.
- Bitcoin is moving higher above the $27,000 resistance.
- The price is trading below $27,800 and the 100 hourly simple moving average.
- There was a break below a key bullish trend line with support near $27,900 on the hourly chart of the BTC/USD pair (data feed from Kraken).
- The pair could rally again if there is a clear move above the $28,000 resistance zone.
Bitcoin Price Eyes Fresh Increase
Bitcoin price failed to clear the $28,500 resistance zone and reacted to the downside. The fed increased rates from 4.75% to 5%, which resulted in a bearish reaction. BTC declined below the $27,500 support zone.
Besides, there was a break below a key bullish trend line with support near $27,900 on the hourly chart of the BTC/USD pair. The pair even traded below the $27,000 level. A low is formed near $26,623 and the price is now correcting losses.
Bitcoin price climbed above the 23.6% Fib retracement level of the downward move from the $28,879 swing high to $26,623 low. It is still trading below $27,800 and the 100 hourly simple moving average.
On the upside, an immediate resistance is near the $27,750 level and trading below $27,800 and the 100 hourly simple moving average. It is near the 50% Fib retracement level of the downward move from the $28,879 swing high to $26,623 low.
Source: BTCUSD on TradingView.com
The next major resistance is near the $28,000 zone. A close above the $28,000 resistance might start another major increase. In the stated case, the price could rise towards the $28,500 level. Any more gains might send the price towards the $28,850 resistance zone.
Dips Supported in BTC?
If bitcoin price fails to clear the $28,000 resistance, it could start anther decline. An immediate support on the downside is near the $27,000 zone.
The next major support is near the $26,600 zone. Any more losses might send the price towards the $26,000 support zone. The next major support is near the $25,200 level.
Technical indicators:
Hourly MACD – The MACD is now losing pace in the bearish zone.
Hourly RSI (Relative Strength Index) – The RSI for BTC/USD is now below the 50 level.
Major Support Levels – $27,000, followed by $26,600.
Major Resistance Levels – $27,750, $28,000 and $28,500.