Reason to trust
How Our News is Made
Strict editorial policy that focuses on accuracy, relevance, and impartiality
Ad discliamer
Morbi pretium leo et nisl aliquam mollis. Quisque arcu lorem, ultricies quis pellentesque nec, ullamcorper eu odio.
Bitcoin price started a downside correction from the $31,000 zone. BTC might decline toward $29,000 before the bulls appear again.
- Bitcoin started a downside correction below the $30,500 pivot level.
- The price is trading below $30,500 and the 100 hourly Simple moving average.
- There is a key bearish trend line forming with resistance near $30,380 on the hourly chart of the BTC/USD pair (data feed from Kraken).
- The pair could extend its decline below the $29,800 and $29,500 support levels.
Bitcoin Price Corrects Lower
Bitcoin price gained pace above the $30,000 and $30,500 levels. BTC even spiked above the $31,000 level before the bears appeared. As a result, there was a bearish reaction below the $30,500 support zone.
The price declined below the $30,250 support zone and tested the $29,800 zone. A low is formed near $29,777 and the price is now consolidating. Bitcoin is now trading below $30,500 and the 100 hourly Simple moving average.
Immediate resistance is near the $30,165 level. It is near the 50% Fib retracement level of the recent decline from the $30,555 swing high to the $29,777 low. The next major resistance is near the $30,400 zone. There is also a key bearish trend line forming with resistance near $30,380 on the hourly chart of the BTC/USD pair.
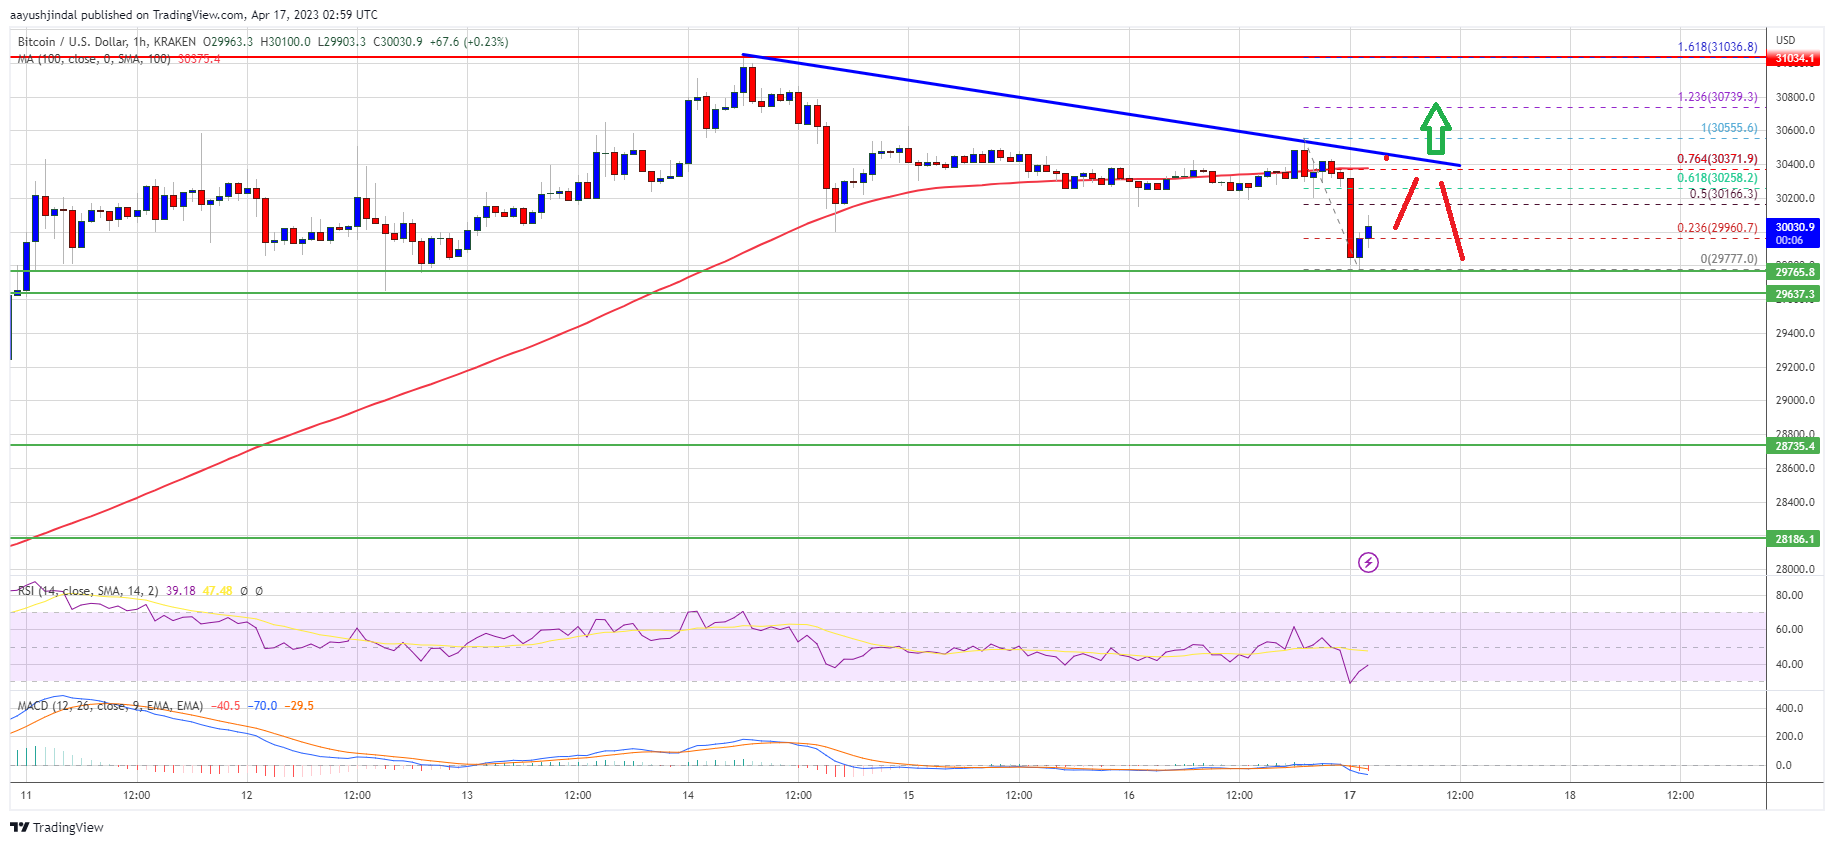
Source: BTCUSD on TradingView.com
The trend line is near the 76.4% Fib retracement level of the recent decline from the $30,555 swing high to the $29,777 low. A close above the $30,400 resistance might start another increase. In the stated case, the price may perhaps rise toward the $31,000 level. The next key resistance is near the $31,200 level, above which BTC could rise toward the $32,000 level.
More Losses in BTC?
If Bitcoin’s price fails to clear the $30,400 resistance, it could continue to move down. Immediate support on the downside is near the $30,000 level.
The next major support is near the $29,800 zone. A downside break and close below the $29,800 support might push the price toward the $29,500 support. Any more losses could lead the price toward $29,000.
Technical indicators:
Hourly MACD – The MACD is now gaining pace in the bearish zone.
Hourly RSI (Relative Strength Index) – The RSI for BTC/USD is now below the 50 level.
Major Support Levels – $30,000, followed by $29,000.
Major Resistance Levels – $30,165, $30,400, and $31,200.