
Reason to trust
How Our News is Made
Strict editorial policy that focuses on accuracy, relevance, and impartiality
Ad discliamer
Morbi pretium leo et nisl aliquam mollis. Quisque arcu lorem, ultricies quis pellentesque nec, ullamcorper eu odio.
Bitcoin price extended its upward move and traded to a new all-time high near $29,250 against the US Dollar. BTC is likely to continue higher towards the $30,000 level.
- Bitcoin is gaining bullish momentum above $28,400 and it broke the $29,000 level.
- The price traded as high as $29,274 and settled well above the 100 hourly simple moving average.
- There is a major breakout pattern forming with support near $28,650 on the hourly chart of the BTC/USD pair (data feed from Kraken).
- The pair is likely to continue higher above $29,000 unless there is a clear break below $28,300.
Bitcoin Price Breaks $29,000
There was a steady increase in bitcoin price above the main $28,300 resistance zone. BTC broke the $28,500 and $29,000 levels to continue higher. It even spiked above USD 29,200 and traded to a new all-time high at $29,274.
Recently, there was a sharp downside correction below the $29,000 level, but it is still well above the 100 hourly simple moving average. The price also spiked below the 23.6% Fib retracement level of the upward move from the $27,375 swing low to $29,274 high.
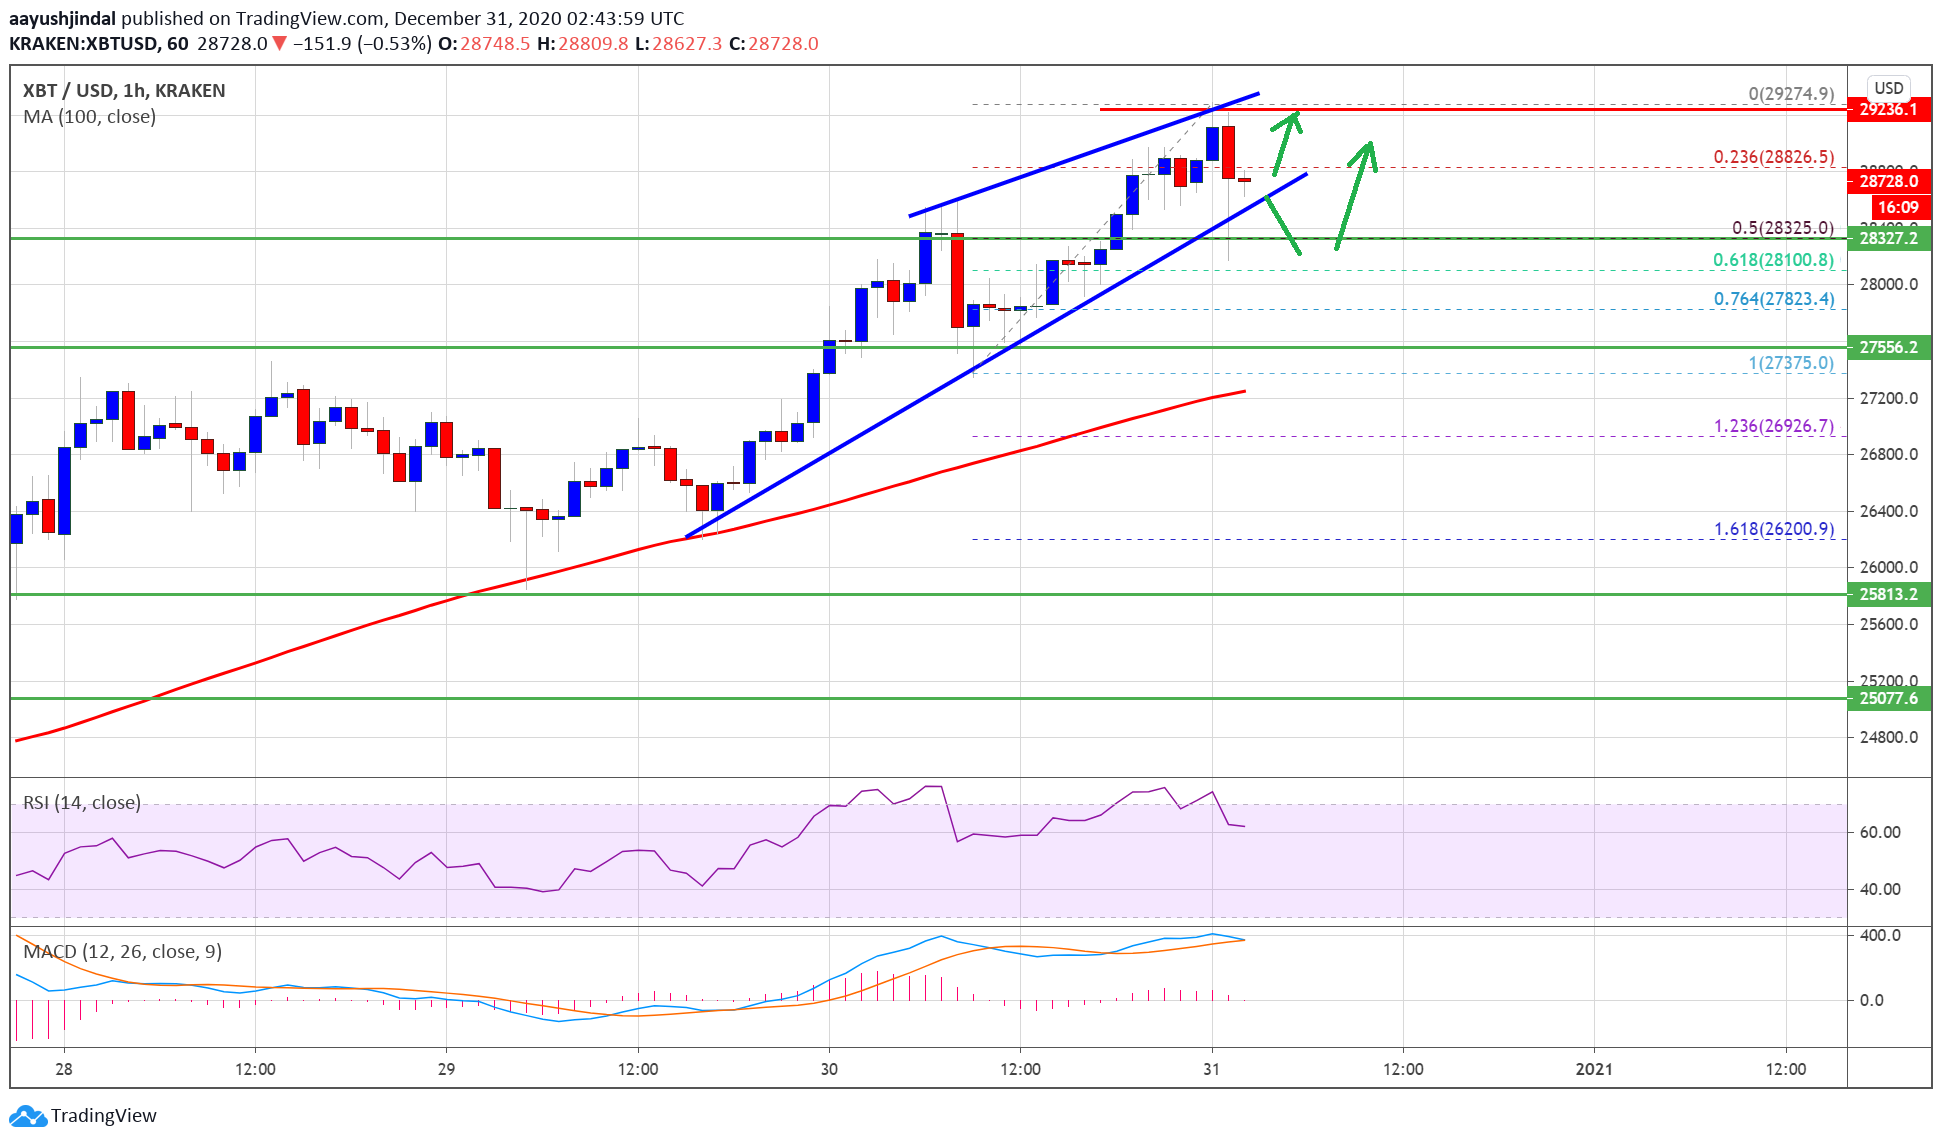
Source: BTCUSD on TradingView.com
Bitcoin price tested the $28,325 support zone. It also remained well bid above the 50% Fib retracement level of the upward move from the $27,375 swing low to $29,274 high. Moreover, there is a major breakout pattern forming with support near $28,650 on the hourly chart of the BTC/USD pair.
On the upside, the price is facing hurdles near $29,200. A clear break above the $29,200 and the recent high could open the doors for more upsides above $29,500. The main aim for the bulls could be $30,000 in the near term.
Dips Supported in BTC?
If bitcoin starts another downside correction, it is likely to find support near the $28,650 zone and the triangle lower trend line.
The next major support is near the $28,300 zone (a multi-touch zone) and a key level. If there are more downsides below $28,300, there is a risk of a larger decline. In the stated case, the price could test $27,500 or even the 100 hourly SMA.
Technical indicators:
Hourly MACD – The MACD is losing momentum in the bullish zone.
Hourly RSI (Relative Strength Index) – The RSI for BTC/USD is correcting lower from the 70 level.
Major Support Levels – $28,650, followed by $28,300.
Major Resistance Levels – $29,000, $29,200 and $30,000.


