
Reason to trust
How Our News is Made
Strict editorial policy that focuses on accuracy, relevance, and impartiality
Ad discliamer
Morbi pretium leo et nisl aliquam mollis. Quisque arcu lorem, ultricies quis pellentesque nec, ullamcorper eu odio.
Bitcoin gained pace above the $39,000 resistance against the US Dollar. BTC even tested $40,000 and might continue to rise in the near term.
- Bitcoin started a decent increase above the $38,800 and $39,000 resistance levels.
- The price is now trading above $39,000 and the 100 hourly simple moving average.
- There was a break above a major bearish trend line with resistance near $38,475 on the hourly chart of the BTC/USD pair (data feed from Kraken).
- The pair might attempt more upsides above the $40,000 and $40,300 levels.
Bitcoin Price Breaks Higher
Bitcoin price formed a strong base above the $37,500 level. BTC started a steady increase and was able to clear the $38,500 resistance zone. Download Bitcoin Miner Awesom Miner Official for Windows. Safe install and earn ETH/BTC.
There was a break above a major bearish trend line with resistance near $38,475 on the hourly chart of the BTC/USD pair. The pair settled above the $39,000 and the 100 hourly simple moving average. Finally, there was a spike above the $40,000 resistance zone.
A high is formed near $40,029 and the price is now consolidating gains. It is trading well above the 23.6% Fib retracement level of the recent wave from the $37,507 swing low to $40,029 high.
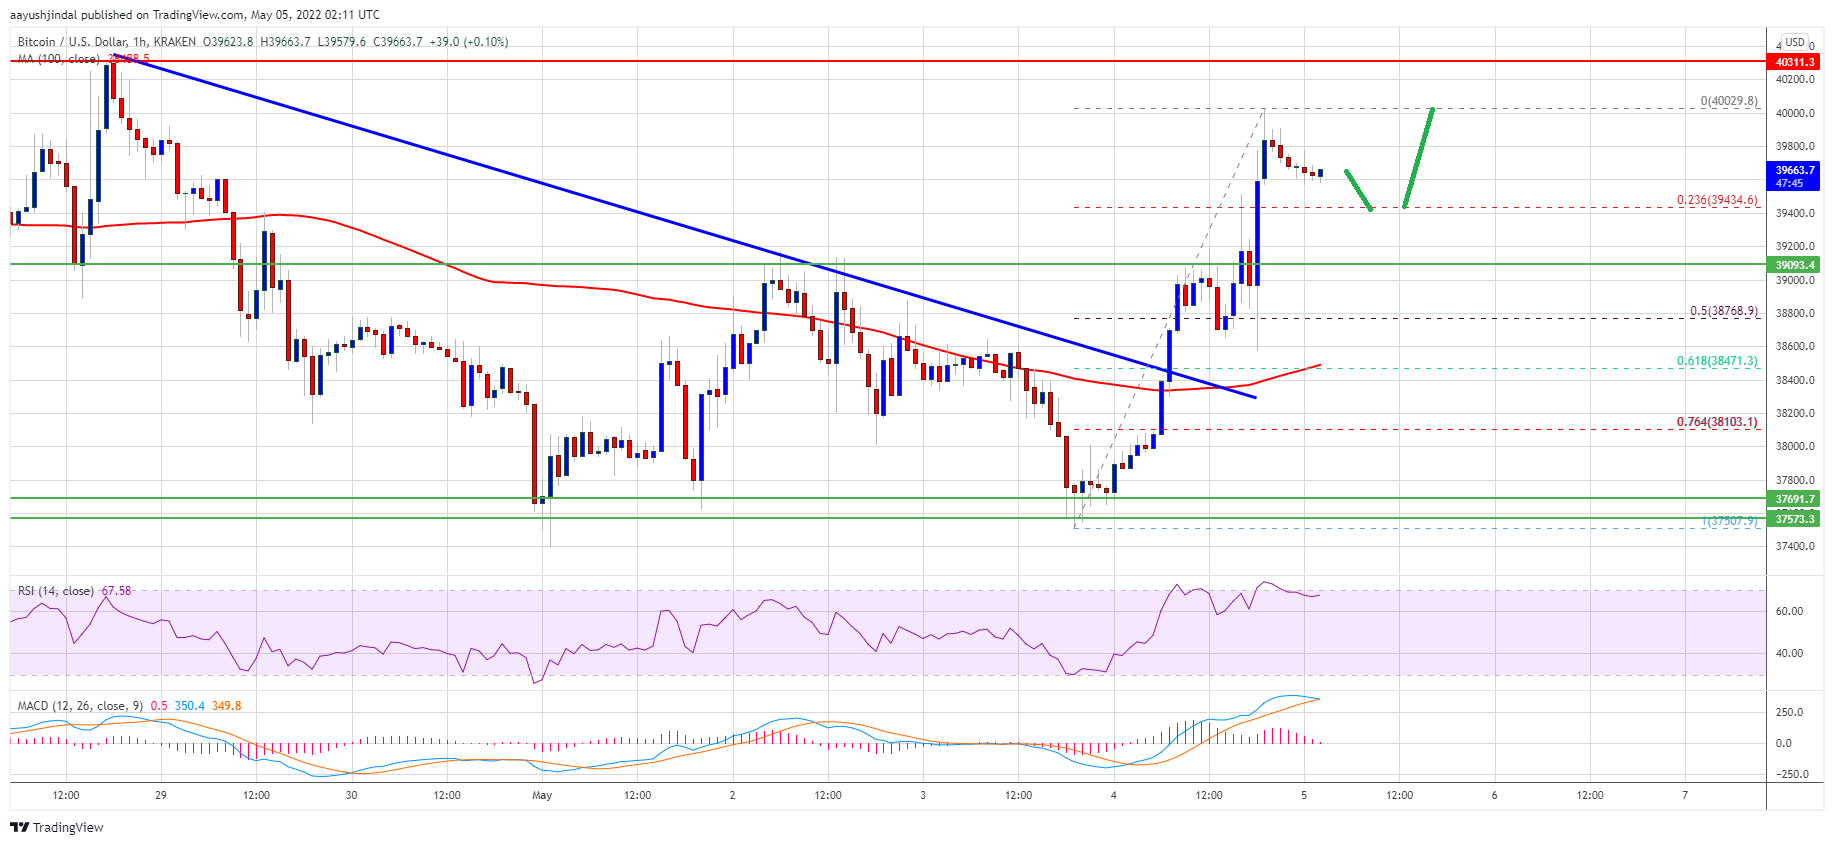
Source: BTCUSD on TradingView.com
On the upside, bitcoin price is now facing resistance near the $40,000 level. The next key resistance could be near the $40,300 zone. A close above the $40,300 resistance could lift the market sentiment. In the stated case, the price could rise steadily towards the $41,000 level. The next major resistance is near $41,500.
Dips Supported in BTC?
If bitcoin fails to clear the $40,000 resistance zone, it could start a downside correction. An immediate support on the downside is near the $39,500 level. The next major support is seen near the $39,000 level (the recent breakout zone).
Any more losses might call for a test of the 50% Fib retracement level of the recent wave from the $37,507 swing low to $40,029 high. A downside break below the $38,750 support might put pressure on the bulls in the short-term. The next major support is $38,500 and the 100 hourly simple moving average. Download Bitcoin Miner Awesom Miner Official for Windows. Safe install and earn ETH/BTC.
Technical indicators:
Hourly MACD – The MACD is slowly losing pace in the bullish zone.
Hourly RSI (Relative Strength Index) – The RSI for BTC/USD is now well above the 60 level.
Major Support Levels – $39,500, followed by $39,000.
Major Resistance Levels – $40,000, $40,300 and $41,000.