
Reason to trust
How Our News is Made
Strict editorial policy that focuses on accuracy, relevance, and impartiality
Ad discliamer
Morbi pretium leo et nisl aliquam mollis. Quisque arcu lorem, ultricies quis pellentesque nec, ullamcorper eu odio.
Bitcoin price struggled again near the $26,500 resistance. BTC is forming a double-top pattern and could revisit the $25,000 support zone.
- Bitcoin recovered above $26,000 but struggled to clear $26,500.
- The price is trading above $25,800 and the 100 hourly Simple moving average.
- There is a short-term contracting triangle forming with resistance near $26,000 on the hourly chart of the BTC/USD pair (data feed from Kraken).
- The pair could start another decline if it breaks the $25,550 support zone.
Bitcoin Price Faces Uphill Task
Bitcoin price started a decent increase above the $26,000 resistance zone. BTC climbed above the $26,200 resistance level but the bears were again active near the $26,500 resistance.
The price failed to settle above the $26,500 resistance level. A high was formed near $26,528 and the price started a downside correction. It seems like there is a double-top pattern forming near the $26,500 zone. The price is now trading below the 23.6% Fib retracement level of the upward move from the $24,925 swing low to the $26,528 high.
However, Bitcoin is now trading above $25,800 and the 100 hourly Simple moving average. Besides, there is a short-term contracting triangle forming with resistance near $26,000 on the hourly chart of the BTC/USD pair.
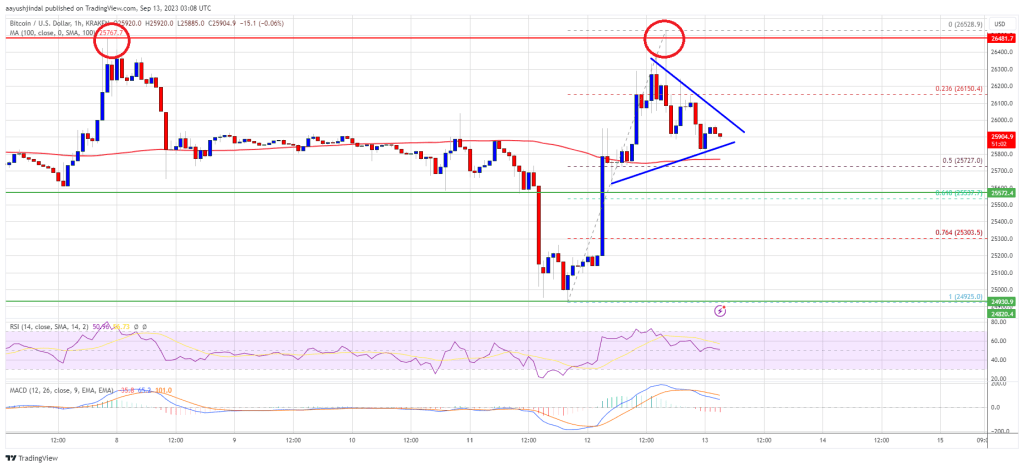
Source: BTCUSD on TradingView.com
Immediate resistance on the upside is near the $26,000 level. The first major resistance is near the $26,200 level. The main resistance is near the $26,500 level. A proper close above the $26,500 level might start a decent increase. The next major resistance is near $27,200, above which the bulls could gain strength. In the stated case, the price could test the $28,000 level.
Another Decline In BTC?
If Bitcoin fails to start a fresh increase above the $26,000 resistance, it could continue to move down. Immediate support on the downside is near the $25,800 level.
The next major support is near the $25,550 level or the 61.8% Fib retracement level of the upward move from the $24,925 swing low to the $26,528 high. A downside break and close below the $25,550 level might call for more downsides. In the stated case, the price could drop toward $25,000 or even $24,800.
Technical indicators:
Hourly MACD – The MACD is now losing pace in the bullish zone.
Hourly RSI (Relative Strength Index) – The RSI for BTC/USD is now near the 50 level.
Major Support Levels – $25,800, followed by $25,550.
Major Resistance Levels – $26,000, $26,200, and $26,500.


