
Reason to trust
How Our News is Made
Strict editorial policy that focuses on accuracy, relevance, and impartiality
Ad discliamer
Morbi pretium leo et nisl aliquam mollis. Quisque arcu lorem, ultricies quis pellentesque nec, ullamcorper eu odio.
Bitcoin price failed to gain strength above the $60,000 resistance against the US Dollar. BTC is showing a few bearish signs and it could decline towards $54,500.
- Bitcoin struggled to clear the $60,000 resistance and it declined below $58,000.
- The price is now trading well below $58,000 and the 100 hourly simple moving average.
- There is a key bearish trend line forming with resistance near $57,500 on the hourly chart of the BTC/USD pair (data feed from Kraken).
- The pair is likely to continue lower towards $54,500 as long as it is below the $58,000 resistance.
Bitcoin Price Turns Red
After another failure to clear the $60,000 resistance, bitcoin started a fresh decline. BTC broke the $58,000 support level to move into a bearish zone.
There was also a break below the $56,500 support level. The price is trading well below $58,000 and the 100 hourly simple moving average. It traded as low as $55,544 before it started an upside correction. There was a break above the $56,500 and $57,000 levels.
The price climbed above the 50% Fib retracement level of the downward move from the $59,901 high to $55,544 low. However, the price failed to clear the $58,000 resistance and the 100 hourly simple moving average.
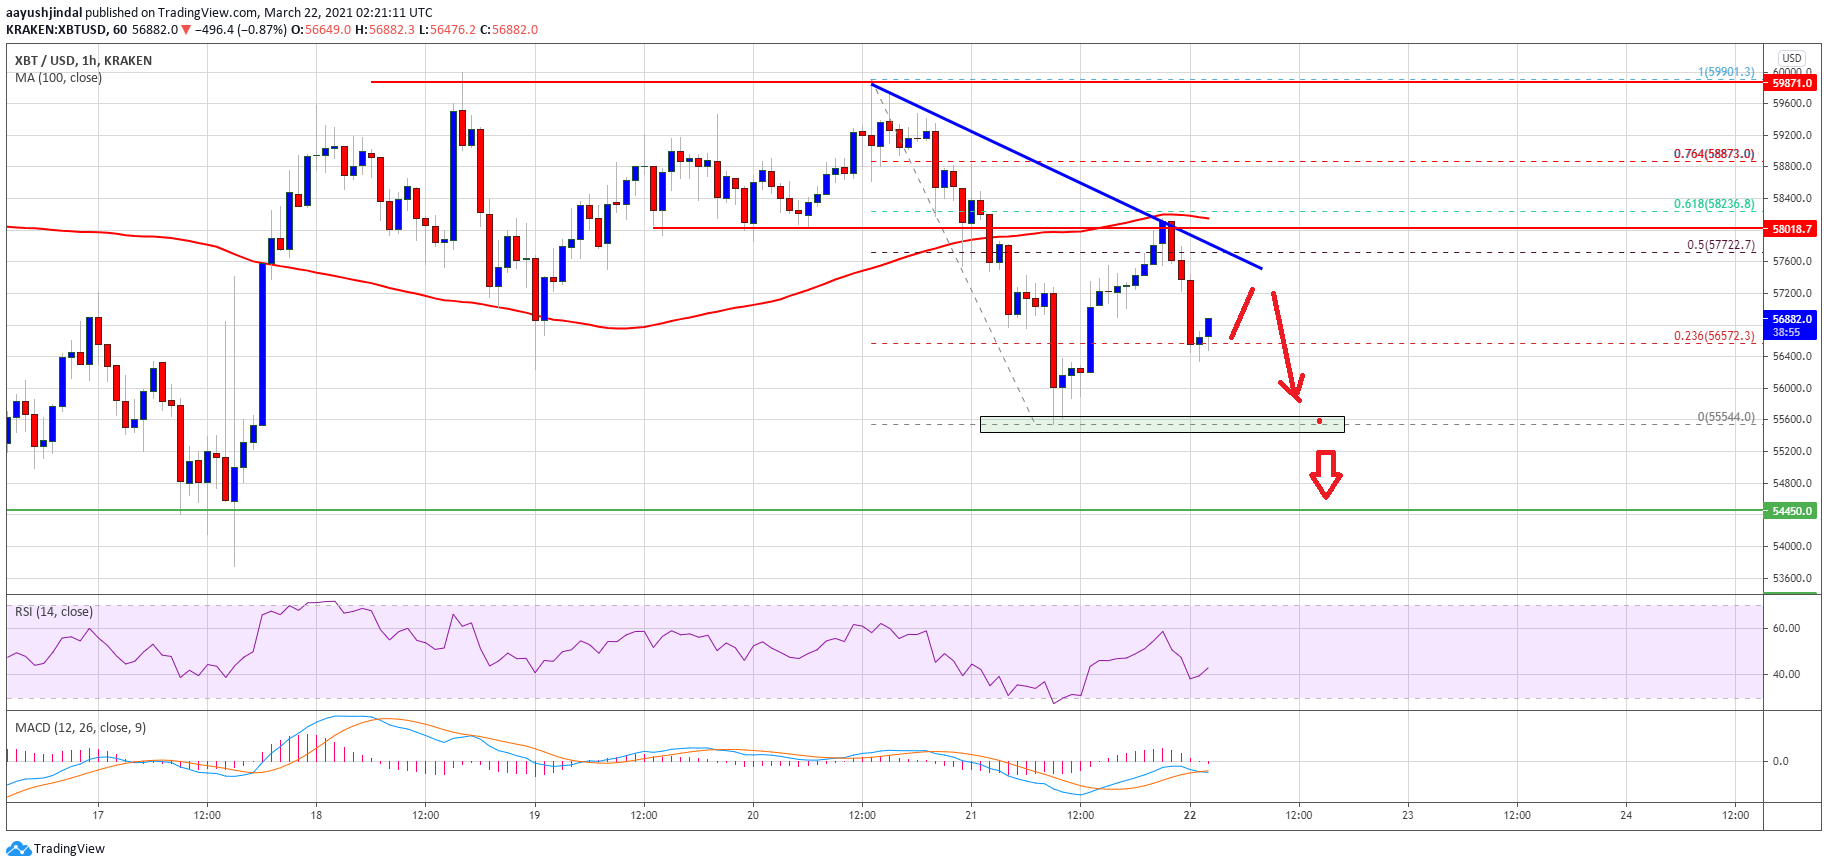
Source: BTCUSD on TradingView.com
There is also a key bearish trend line forming with resistance near $57,500 on the hourly chart of the BTC/USD pair. The pair also failed to clear the 61.8% Fib retracement level of the downward move from the $59,901 high to $55,544 low.
If it now showing bearish signs below the $57,800 and $58,000 levels. If there are more losses, the price could break the $55,544 low. The next major support for the bulls sits near $54,500.
Fresh Increase in BTC?
If bitcoin stays above the $55,544 low, it could start a fresh increase. An initial resistance on the upside is near the $57,800 level.
The main resistance is near the $58,000 level. A clear break above the $58,000 level may possibly push the price towards the key $60,000 resistance zone. Any more gains could start a pump towards the $62,000 level.
Technical indicators:
Hourly MACD – The MACD is slowly moving in the bearish zone.
Hourly RSI (Relative Strength Index) – The RSI for BTC/USD is now below the 50 level.
Major Support Levels – $55,540, followed by $54,500.
Major Resistance Levels – $57,800, $58,000 and $60,000.