
Reason to trust
How Our News is Made
Strict editorial policy that focuses on accuracy, relevance, and impartiality
Ad discliamer
Morbi pretium leo et nisl aliquam mollis. Quisque arcu lorem, ultricies quis pellentesque nec, ullamcorper eu odio.
Bitcoin price is again moving lower toward the $29,200 level. BTC must surpass $30,500 to attempt a fresh increase in the near term.
- Bitcoin is showing bearish signs and trading well below the $30,500 zone.
- The price is trading below $30,300 and the 100 hourly Simple moving average.
- There is a key bearish trend line forming with resistance near $30,200 on the hourly chart of the BTC/USD pair (data feed from Kraken).
- The pair could continue to move down if it stays below the $30,500 resistance.
Bitcoin Price Extends Decline
Bitcoin price attempted a fresh increase above the $30,250 level but failed to gain bullish momentum. BTC stayed below the key $30,500 resistance zone.
A high was formed near $30,447 before the price dropped below $30,000. It traded to a new weekly low at $29,669 and is currently correcting losses. It broke the 50% Fib retracement level of the recent decline from the $30,447 swing high to the $29,669 low.
The price was able to climb above the $30,000 level. Bitcoin price is now trading below $30,300 and the 100 hourly Simple moving average. Immediate resistance is near the $30,200 level.
There is also a key bearish trend line forming with resistance near $30,200 on the hourly chart of the BTC/USD pair. The trend line is near the 61.8% Fib retracement level of the recent decline from the $30,447 swing high to the $29,669 low.
The first major resistance is near $30,265. The main resistance is now forming near the $30,450 and $30,500 levels. A close above the $30,500 level might start a fresh increase.
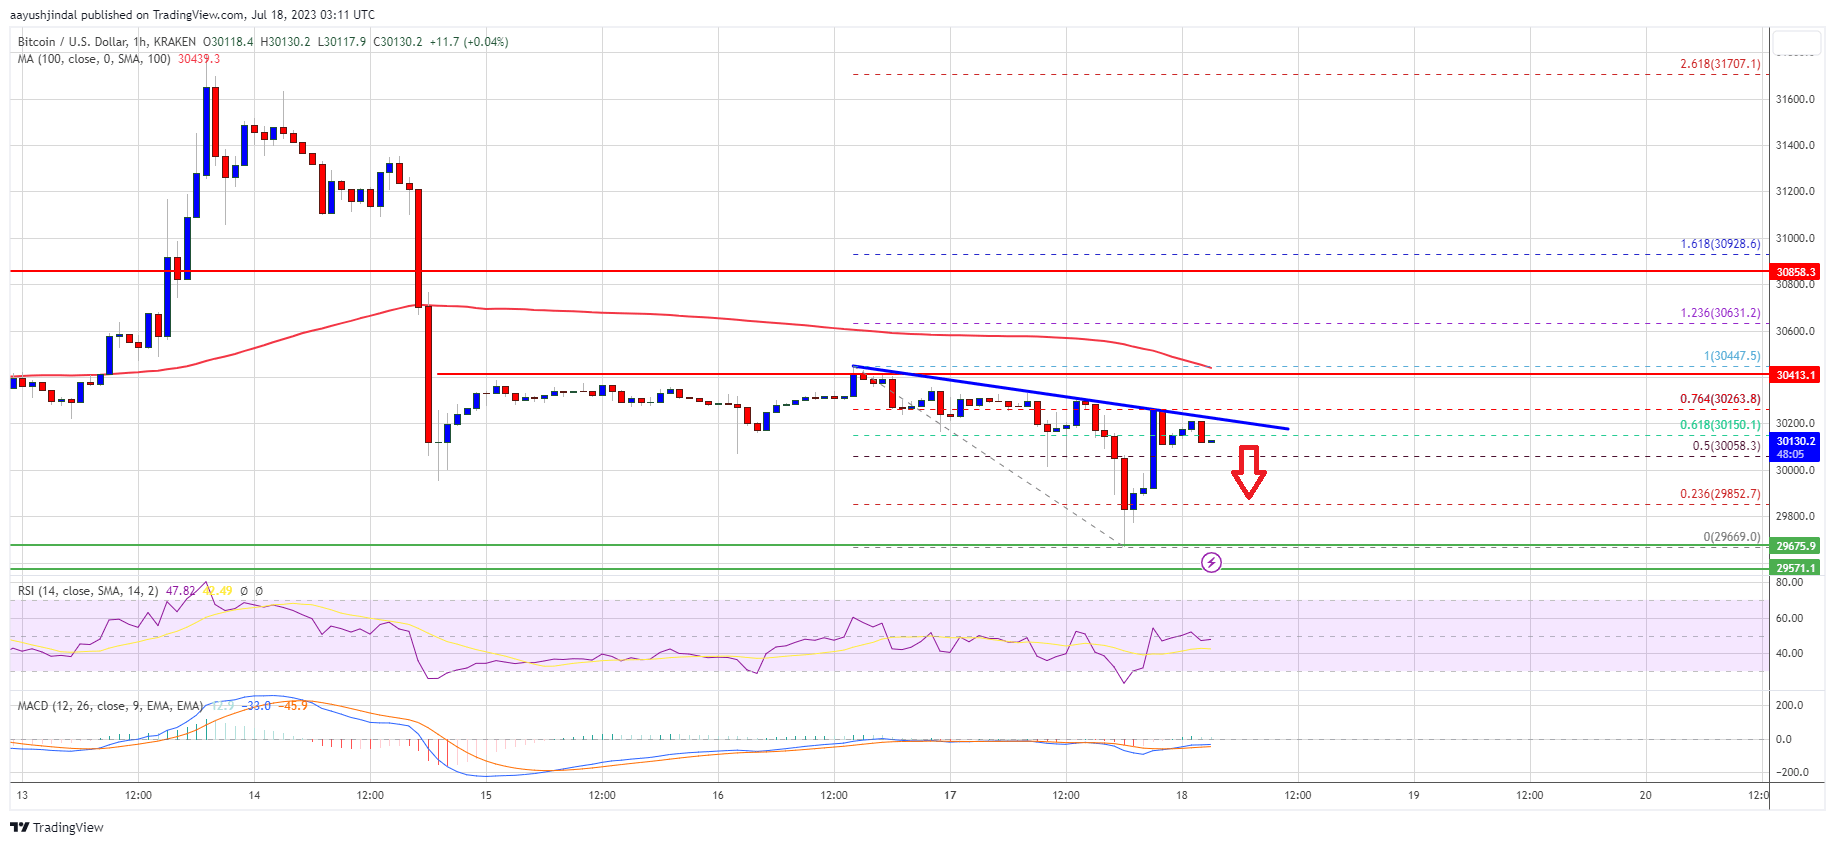
Source: BTCUSD on TradingView.com
The next major resistance is near the $30,850 level. Any more gains could open the doors for a move toward the $31,500 resistance zone.
More Losses in BTC?
If Bitcoin fails to clear the $30,500 resistance, it could continue to move down. Immediate support on the downside is near the $29,850 level.
The next major support is near the $29,550 level, below which there could be a drop toward the $29,200 support zone. Any more losses might send the price toward the $28,750 level in the near term.
Technical indicators:
Hourly MACD – The MACD is now gaining pace in the bearish zone.
Hourly RSI (Relative Strength Index) – The RSI for BTC/USD is now near the 50 level.
Major Support Levels – $29,850, followed by $29,200.
Major Resistance Levels – $30,200, $30,265, and $30,500.