
Reason to trust
How Our News is Made
Strict editorial policy that focuses on accuracy, relevance, and impartiality
Ad discliamer
Morbi pretium leo et nisl aliquam mollis. Quisque arcu lorem, ultricies quis pellentesque nec, ullamcorper eu odio.
Bitcoin price gained bullish momentum and it broke the $16,500 resistance against the US Dollar. BTC is likely to continue higher towards $17,000 as long as it is above $16,200.
- Bitcoin regained strength and it broke the $16,500 and $16,600 resistance levels.
- The price traded to a new monthly high at $16,897 and settled above the 100 hourly simple moving average.
- There is a short-term contracting triangle forming with resistance near $16,725 on the hourly chart of the BTC/USD pair (data feed from Kraken).
- The pair could correct a few points, but the bulls are likely to remain active near $16,500.
Bitcoin Price Signaling More Upsides
After forming a base near the $15,800 level, bitcoin price started a fresh increase. BTC broke the $16,200 and $16,350 resistance levels to move back into a positive zone.
The upward move was such that the price broke the $16,500 resistance. The price traded towards the $17,000 level and a new monthly high was formed near $16,897. Bitcoin is currently consolidating gains below $16,800 and it is well above the 100 hourly simple moving average.
An initial support is near the $16,630 level. It is close to the 23.6% Fib retracement level of the recent rally from the $15,796 low to $16,897 high. There is also a short-term contracting triangle forming with resistance near $16,725 on the hourly chart of the BTC/USD pair.
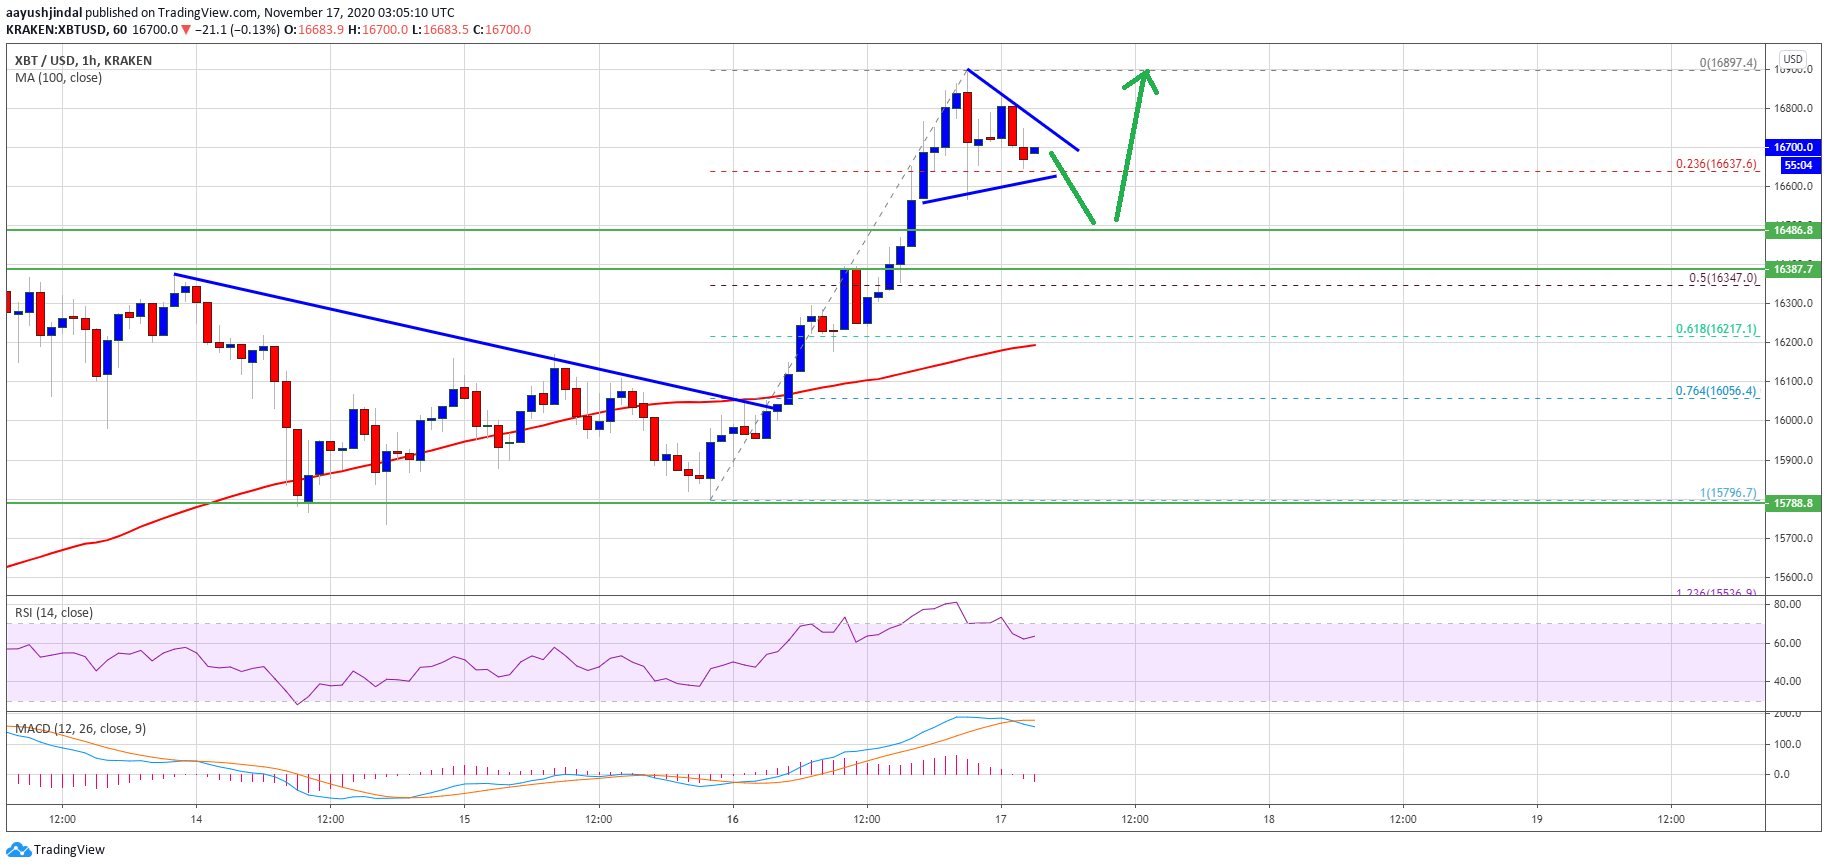
Source: BTCUSD on TradingView.com
The triangle support is close to the $16,630 level, below which the price could test the 50% Fib retracement level of the recent rally from the $15,796 low to $16,897 high.
On the upside, a clear break above the $16,725 and $16,750 levels might start a fresh increase. The next major resistance is near the $16,850 and $16,900 levels, above which the bulls are likely to aim a break above the $17,000 level.
Dips Supported in BTC?
If bitcoin fails to clear the triangle resistance or $16,750, there could be a short-term downside correction. A clear break below the triangle support might lead the price towards the $16,500 support zone.
The next major support is near the $16,350 level. Any further losses may perhaps lead the price towards the $16,200 support level and the 100 hourly simple moving average.
Technical indicators:
Hourly MACD – The MACD is slowly moving into the bearish zone.
Hourly RSI (Relative Strength Index) – The RSI for BTC/USD is currently correcting lower towards the 60 level.
Major Support Levels – $16,500, followed by $16,350.
Major Resistance Levels – $16,750, $16,850 and $17,000.