
Reason to trust
How Our News is Made
Strict editorial policy that focuses on accuracy, relevance, and impartiality
Ad discliamer
Morbi pretium leo et nisl aliquam mollis. Quisque arcu lorem, ultricies quis pellentesque nec, ullamcorper eu odio.
Bitcoin price is down over 15% and it broke many supports near $32,000 against the US Dollar. BTC even traded close to $28.5K and it is currently correcting losses.
- Bitcoin started a strong decline below the $33,000 and $32,000 support levels.
- The price is currently correcting losses, but it is now well below $32,000 and the 100 hourly simple moving average.
- There is a key bearish trend line forming with resistance near $32,700 on the hourly chart of the BTC/USD pair (data feed from Kraken).
- The pair is likely to face a strong selling interest near the $32,000 and $32,800 levels.
Bitcoin Price Turns Red
Yesterday, we discussed the chances of more losses in bitcoin price below $33,000. BTC failed to recover above $34,500 and it started a strong decline. There was a break below many important supports near $33,000 and $32,800.
It opened the doors for more downsides below $32,000 and the price settled well below the 100 hourly simple moving average. The price even tumbled below the $30,000 level. It traded close to the $28,500 support and it is currently correcting losses.
There was a break above the $30,000 level. Bitcoin price is now trading above the 23.6% Fib retracement level of the recent decline from the $32,707 high to $28,808 low.
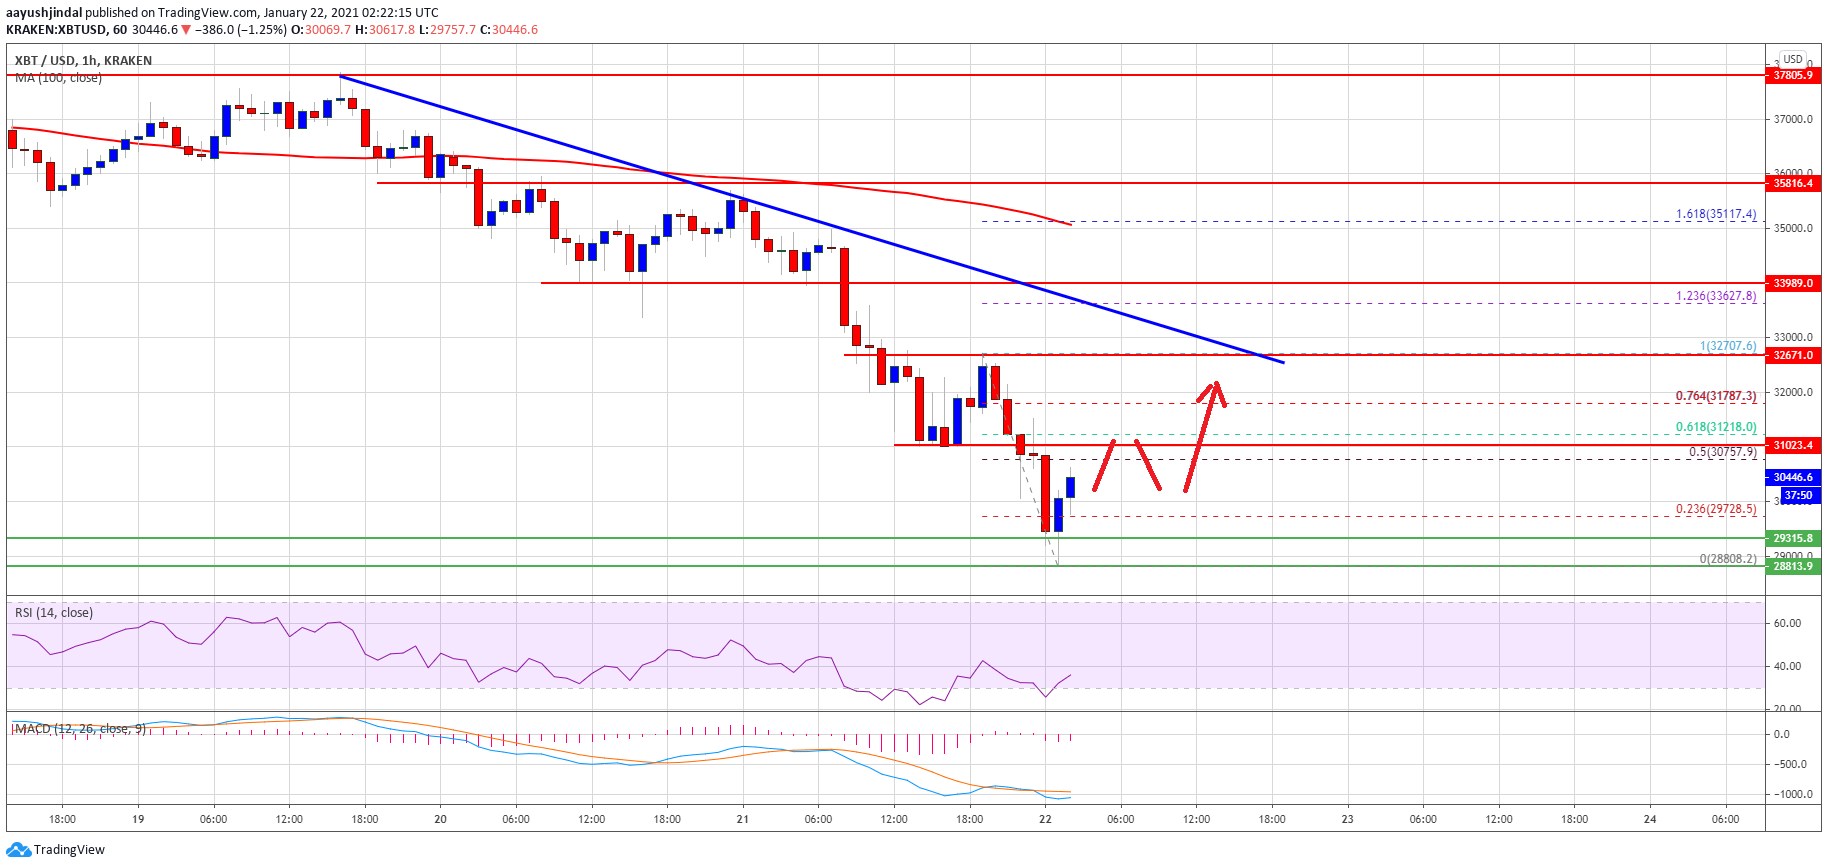
Source: BTCUSD on TradingView.com
On the upside, the first resistance is near the $30,800 and $31,000 levels. The 50% Fib retracement level of the recent decline from the $32,707 high to $28,808 low is also near the $30,800 level. The next key resistance is near the $32,000 level.
There is also a key bearish trend line forming with resistance near $32,700 on the hourly chart of the BTC/USD pair. To move into a positive zone, the price must clear $32,800 and $33,000 (support turned resistance).
More Downsides in BTC?
If bitcoin fails to recover above $31,000 and $31,800, there is a risk of another decline. An initial support on the downside is near the $30,000 level.
The first major support is near the $28,800 and $28,500 levels. A close below the $28,000 support zone could open the doors for a drop towards the $25,000 support zone in the coming sessions.
Technical indicators:
Hourly MACD – The MACD is slowly gaining momentum in the bullish zone.
Hourly RSI (Relative Strength Index) – The RSI for BTC/USD is now recovering towards the 40 level.
Major Support Levels – $30,000, followed by $28,800.
Major Resistance Levels – $30,800, $31,000 and $32,800.


