
Reason to trust
How Our News is Made
Strict editorial policy that focuses on accuracy, relevance, and impartiality
Ad discliamer
Morbi pretium leo et nisl aliquam mollis. Quisque arcu lorem, ultricies quis pellentesque nec, ullamcorper eu odio.
Bitcoin price is consolidating gains above the $58,000 resistance against the US Dollar. BTC is likely to surge above the $59,500 and $60,000 resistance levels in the near term.
- Bitcoin is showing a lot of bullish signs, but it is still below the $60,000 resistance zone.
- The price is trading nicely above the $58,000 support and the 100 hourly simple moving average.
- There is a crucial contracting triangle forming with resistance near $59,200 on the hourly chart of the BTC/USD pair (data feed from Kraken).
- The pair could start a strong increase once it clears the $59,200 and $59,500 levels.
Bitcoin Price is Likely to Rally Soon
Bitcoin failed to settle above the $59,500 resistance and recently started a downside correction. BTC broke the $59,000 level and it even traded below the $58,500 support.
However, the bulls were active near the $58,000 support and the 100 hourly simple moving average. A low is formed near $57,922 and it seems like the price is trading in a contracting range. It has already recovered above the $58,500 level.
There was a break above the 50% Fib retracement level of the recent decline from the $59,650 high to $57,922 low. Bitcoin is now facing resistance near the $59,200 level.
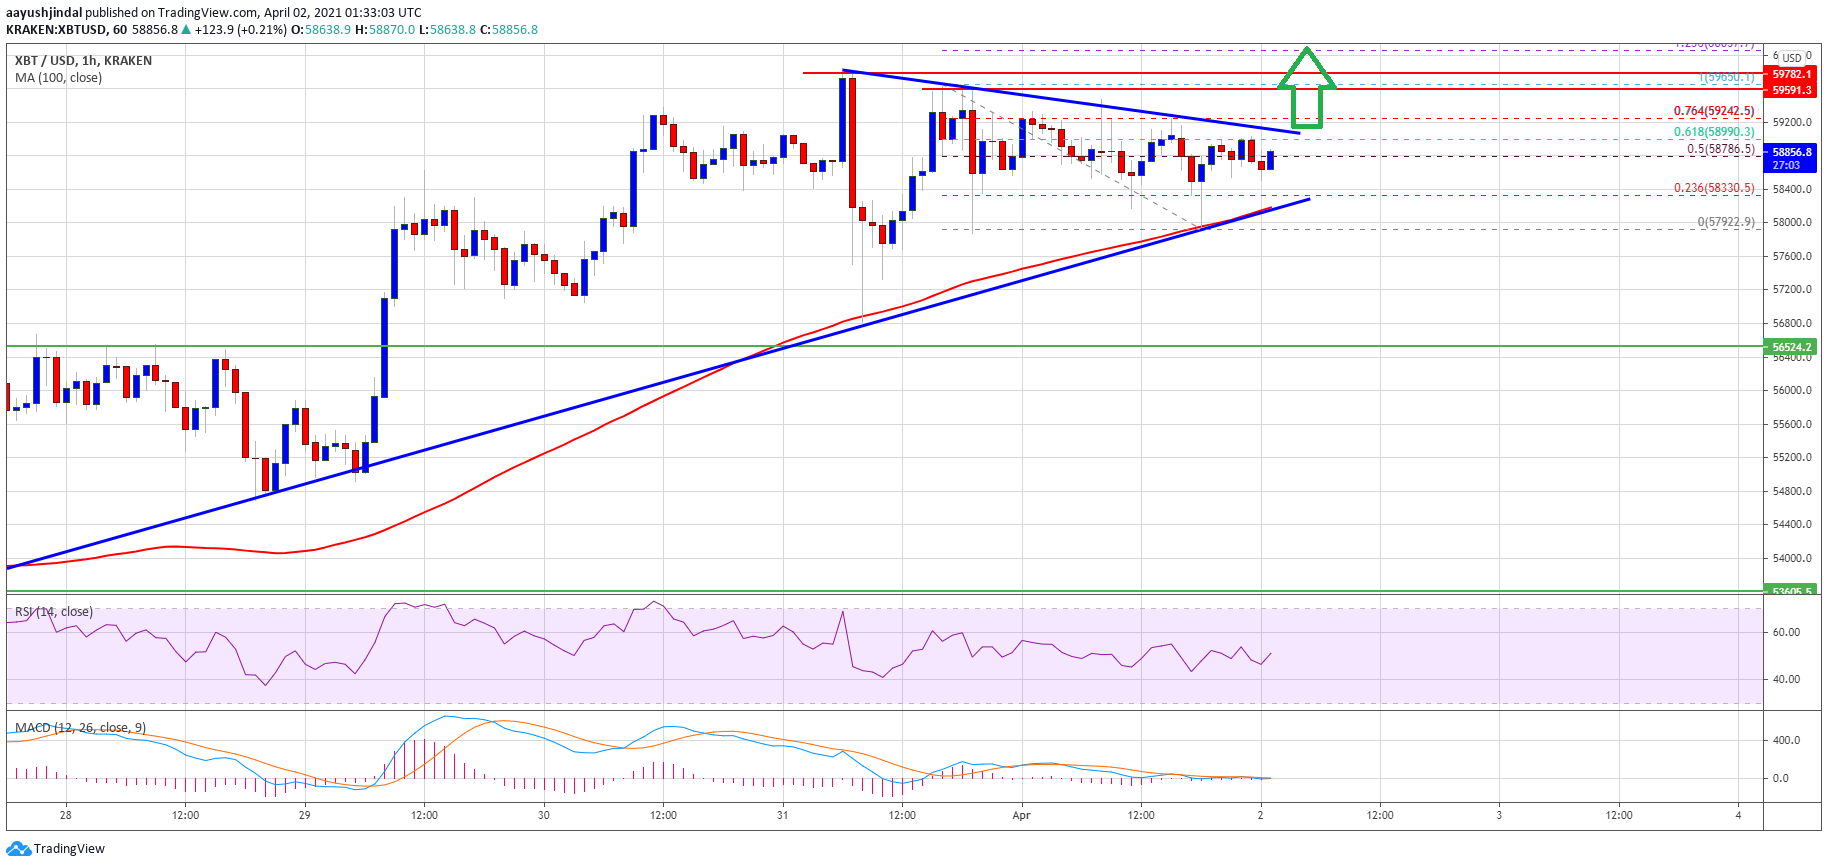
Source: BTCUSD on TradingView.com
It seems like there is a crucial contracting triangle forming with resistance near $59,200 on the hourly chart of the BTC/USD pair. The triangle resistance is near the 61.8% Fib retracement level of the recent decline from the $59,650 high to $57,922 low.
A successful break above the triangle resistance could open the doors for a massive bullish wave. The next major resistance is near the $59,500 zone, above which the price is likely to rally above $60,000.
Dips Limited in BTC?
If bitcoin fails to climb above $59,200 and $60,000, there could be a downside correction. The first major support on the downside is near the $58,500 level.
The next major support is near the $58,350 level, the 100 hourly SMA, and the triangle trend line. If there is a downside break below the triangle support, the price could dive towards $56,500.
Technical indicators:
Hourly MACD – The MACD is slowly gaining momentum in the bullish zone.
Hourly RSI (Relative Strength Index) – The RSI for BTC/USD is just above the 50 level.
Major Support Levels – $58,500, followed by $58,350.
Major Resistance Levels – $59,200, $59,500 and $60,000.