
Reason to trust
How Our News is Made
Strict editorial policy that focuses on accuracy, relevance, and impartiality
Ad discliamer
Morbi pretium leo et nisl aliquam mollis. Quisque arcu lorem, ultricies quis pellentesque nec, ullamcorper eu odio.
Bitcoin price rallied more than 5%% and it even broke the $13,000 resistance against the US Dollar. BTC is now correcting gains, but there are key supports near $12,500.
- Bitcoin gained bullish momentum and it rallied above the $12,500 and $13,000 resistance levels.
- The price traded to a new monthly high at $13,243 and it is well above the 100 hourly simple moving average.
- There is a key bullish trend line forming with support near $12,650 on the hourly chart of the BTC/USD pair (data feed from Kraken).
- The pair is likely to resume its upward move as long as it is above $12,650 and $12,500.
Bitcoin Price Rallies Above $13K
Bitcoin price extended its rise and broke many hurdles near the $12,500 level. BTC even surged above the $13,000 resistance level and settled well above the 100 hourly simple moving average.
A new monthly high is formed near the $13,243 level before the price started a sharp downside correction. It declined more than $500 and broke the $13,000 level. There was also a break below the 23.6% Fib retracement level of the recent rally from the $12,155 low to $13,243 high.
However, the price is holding a couple of important support near $12,700 and $12,650. There is also a key bullish trend line forming with support near $12,650 on the hourly chart of the BTC/USD pair.
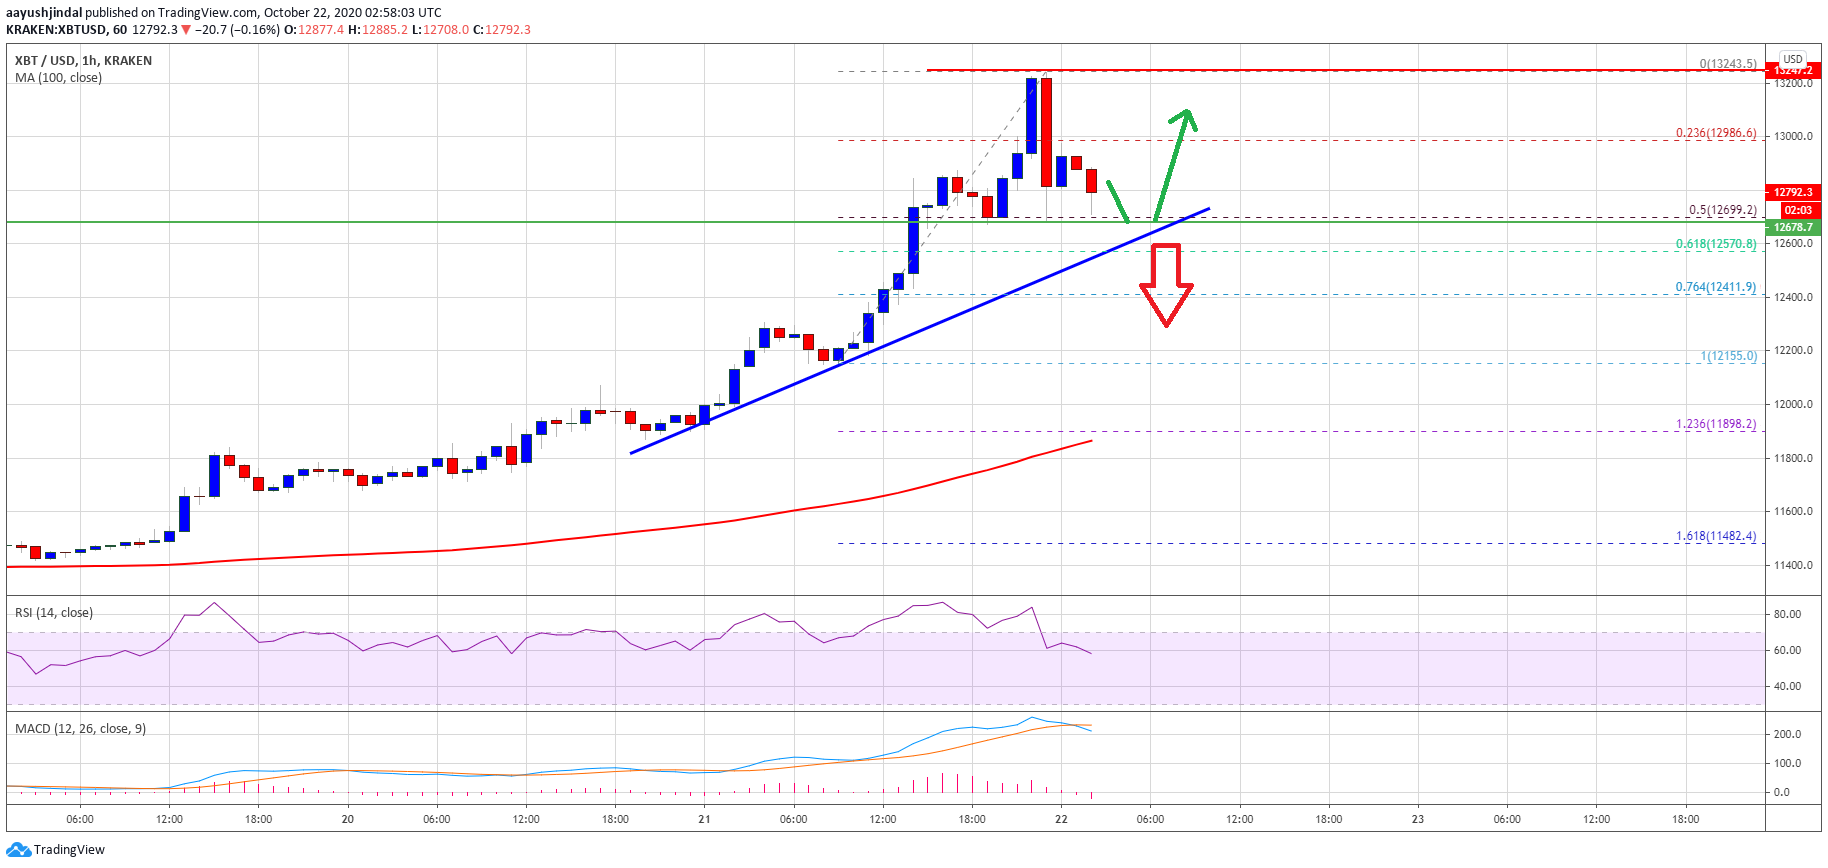
Source: BTCUSD on TradingView.com
The trend line is close to the 50% Fib retracement level of the recent rally from the $12,155 low to $13,243 high. If bitcoin stays above the trend line support, it is likely to resume its upward move above the $12,850 and $13,000 levels.
The next key resistance is near the $13,250 level. A clear break above the recent high and $13,250 could open the doors for a test of the $13,650 zone in the coming sessions.
More Downsides in BTC?
If bitcoin fails to stay above the trend line support and $12,650, it could extend its downside correction. The next major support is near the $12,500 level.
Any further losses could start a larger degree downside correction may be towards the $12,000 support or the 100 hourly simple moving average.
Technical indicators:
Hourly MACD – The MACD is slowly losing momentum in the bearish zone.
Hourly RSI (Relative Strength Index) – The RSI for BTC/USD is still well above the 50 level, with a minor bearish angle.
Major Support Levels – $12,650, followed by $12,500.
Major Resistance Levels – $12,850, $13,000 and $13,250.


