
Reason to trust
How Our News is Made
Strict editorial policy that focuses on accuracy, relevance, and impartiality
Ad discliamer
Morbi pretium leo et nisl aliquam mollis. Quisque arcu lorem, ultricies quis pellentesque nec, ullamcorper eu odio.
Bitcoin price is gaining traction and it broke $13,500 and $13,800 resistance levels against the US Dollar. BTC is likely to continue higher above the $14,000 resistance.
- Bitcoin is up over 5% and it surpassed the main $13,500 resistance level.
- The price is trading with a positive angle above $13,800 and the 100 hourly simple moving average.
- There was a break above a major bearish trend line with resistance near $13,100 on the hourly chart of the BTC/USD pair (data feed from Kraken).
- The pair is likely to gain strength above the $14,000 resistance level in the near term.
Bitcoin Price is Gaining Momentum
Bitcoin price remained in a positive zone after it cleared the key $13,500 resistance zone. BTC settled nicely above the $13,500 level and the 100 hourly simple moving average to open the doors for more gains.
More importantly, there was a break above a major bearish trend line with resistance near $13,100 on the hourly chart of the BTC/USD pair. The pair gained momentum and it even broke the $13,800 resistance level.
A high is formed near $13,851 and the price is showing no major signs of trend exhaustion. If there is a downside correction, the $13,750 level is an initial support. It is close to the 23.6% Fib retracement level of the recent wave from the $13,352 swing low to $13,851 high.
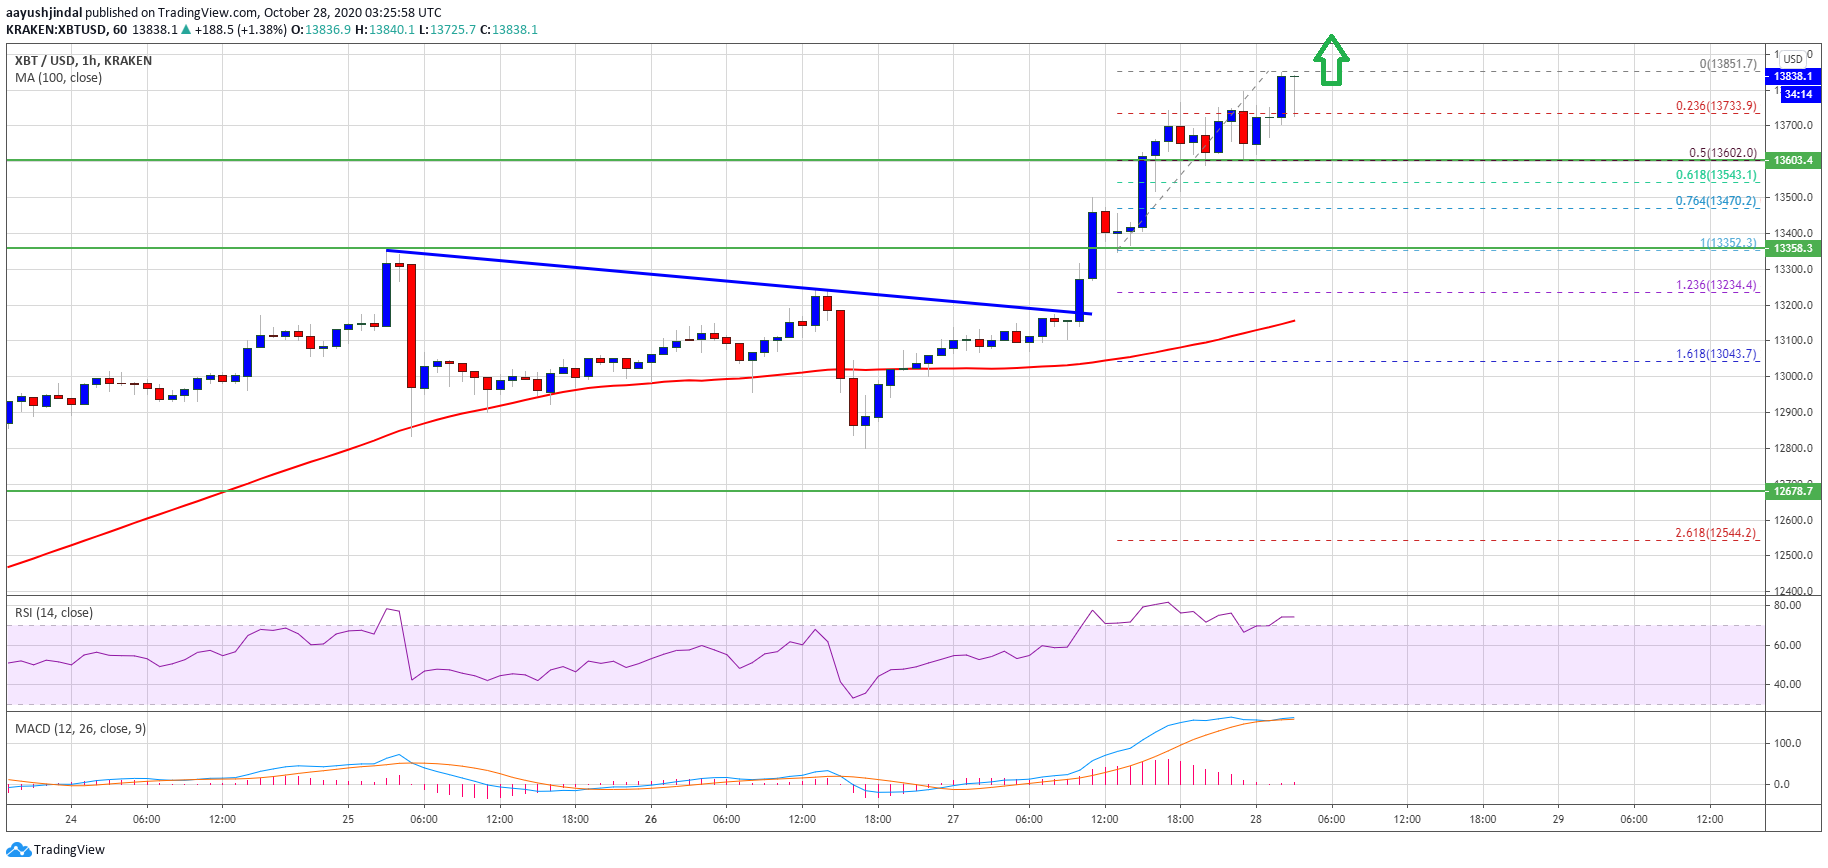
Source: BTCUSD on TradingView.com
The first major support is near the $13,600 level. It represents the 50% Fib retracement level of the recent wave from the $13,352 swing low to $13,851 high.
On the upside, the $13,850 level is a short-term resistance. The main resistance is near the $14,000 level, above which the bulls are likely to gain strength for another rally. The next stop could be $14,200 or even $14,400.
Downside Correction in BTC?
If bitcoin fails to climb above the $13,850 or $14,000 resistance levels, there is a risk of a short-term downside correction. An initial support is near the $13,750 zone.
The main support is near the $13,600 and $13,500 levels, below which there are chances of a larger decline towards the $13,000 support level (the previous breakout zone).
Technical indicators:
Hourly MACD – The MACD is now gaining momentum in the bullish zone.
Hourly RSI (Relative Strength Index) – The RSI for BTC/USD is now well above the 50 level, with positive signs.
Major Support Levels – $13,750, followed by $13,600.
Major Resistance Levels – $13,850, $14,000 and $14,000.