
Reason to trust
How Our News is Made
Strict editorial policy that focuses on accuracy, relevance, and impartiality
Ad discliamer
Morbi pretium leo et nisl aliquam mollis. Quisque arcu lorem, ultricies quis pellentesque nec, ullamcorper eu odio.
Bitcoin price is holding gains above $23,000 and $23,200 against the US Dollar. BTC is showing positive signs and it seems to be preparing for more upsides above $24K
- Bitcoin is trading nicely above the $23,000 and $23,200 support levels.
- The price is currently trading near $23,800 and it is well above the 100 hourly simple moving average.
- There is a key bullish trend line forming with support near $23,080 on the hourly chart of the BTC/USD pair (data feed from Kraken).
- The pair is likely to continue higher above $24,000 and $24,200 in the coming sessions.
Bitcoin Price is Eyeing More Upsides
In the past 2-3 sessions, there were mostly range moves in bitcoin price above the $23,000 support. BTC seems to be forming a strong support base near $23,000, $23,200, and the 100 hourly simple moving average.
The recent low was formed near $23,078 before the price climbed higher above $23,500. There was a break above the 50% Fib retracement level of the latest decline from the $24,301 high to $23,078 low. There is also a key bullish trend line forming with support near $23,080 on the hourly chart of the BTC/USD pair.
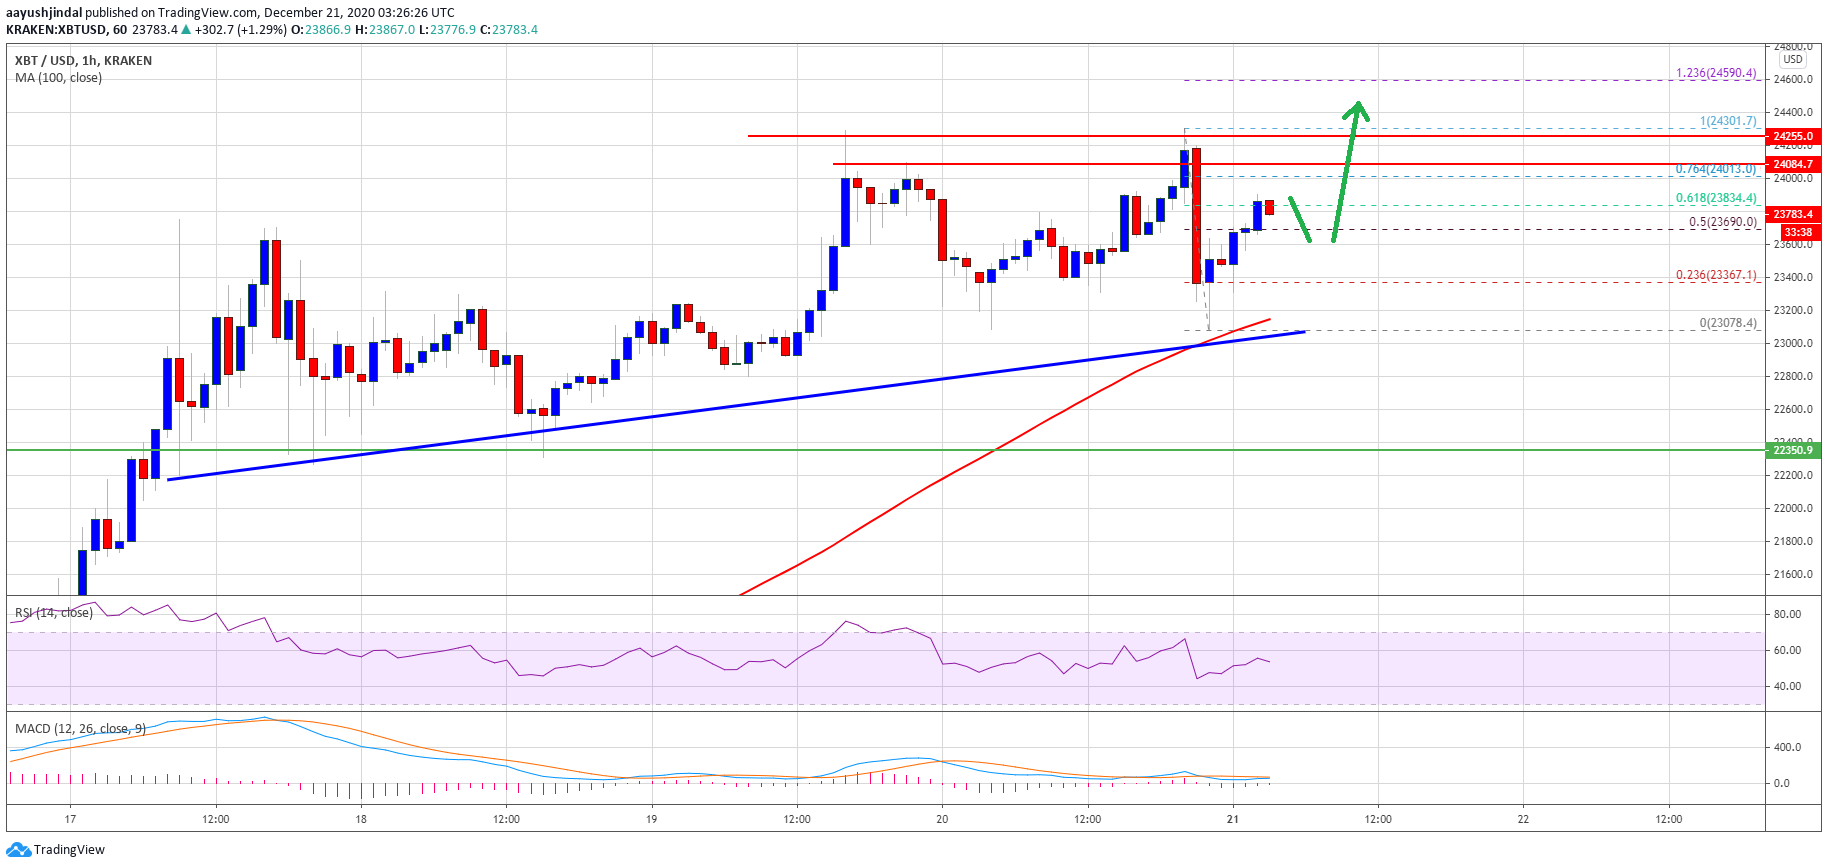
Source: BTCUSD on TradingView.com
However, the price seems to be facing resistance near the $23,800 level. The 61.8% Fib retracement level of the latest decline from the $24,301 high to $23,078 low is also acting as a resistance for the bulls. A clear break above the $23,800 zone could open the doors for more gains above $24,000 and $24,080.
The next key resistance for bitcoin is near the $24,300 level, above which the price is likely to continue higher towards the $24,500 and $24,600 levels in the coming sessions.
Downsides Supported in BTC?
If bitcoin starts another short-term downside correction, it could find support near the $23,500 level. The first key support is near the $23,200 level.
The main support is forming near the $23,000 level and the 100 hourly simple moving average. A daily close below the $23,000 support and the 100 hourly simple moving average might call for an extended downside correction. The next major support could be near the $22,350 level.
Technical indicators:
Hourly MACD – The MACD is slowly gaining momentum in the bullish zone.
Hourly RSI (Relative Strength Index) – The RSI for BTC/USD is currently well above the 50 level.
Major Support Levels – $23,200, followed by $23,000.
Major Resistance Levels – $23,800, $24,000 and $24,300.