
Reason to trust
How Our News is Made
Strict editorial policy that focuses on accuracy, relevance, and impartiality
Ad discliamer
Morbi pretium leo et nisl aliquam mollis. Quisque arcu lorem, ultricies quis pellentesque nec, ullamcorper eu odio.
Bitcoin price broke the $19,200 resistance, but it is still struggling near $19,500 against the US Dollar. BTC could decline sharply if there is a clear break below $19,150 and $19,000.
- Bitcoin is struggling to gain bullish momentum above $19,400 and $19,500.
- The price is approaching the $19,150 support and the 100 hourly simple moving average.
- There was a break above a major bearish trend line with resistance at $19,150 on the hourly chart of the BTC/USD pair (data feed from Kraken).
- The pair struggled to capitalize and it is currently sliding from the $19,432 swing high.
Bitcoin Price is Attempting Upside Break
There was a steady increase in bitcoin price after a couple of spikes below $19,000. BTC broke the $19,000 resistance level and it even settled above the 100 hourly simple moving average.
More importantly, there was a break above a major bearish trend line with resistance at $19,150 on the hourly chart of the BTC/USD pair. The pair surpassed the $19,400 level, but there was lack of bullish momentum.
Bitcoin struggled to even test the $19,500 resistance level after the trend line break. A high is formed near $19,432 and the price is currently declining. It broke the 23.6% Fib retracement level of the recent wave from the $18,868 low to $19,432 high.
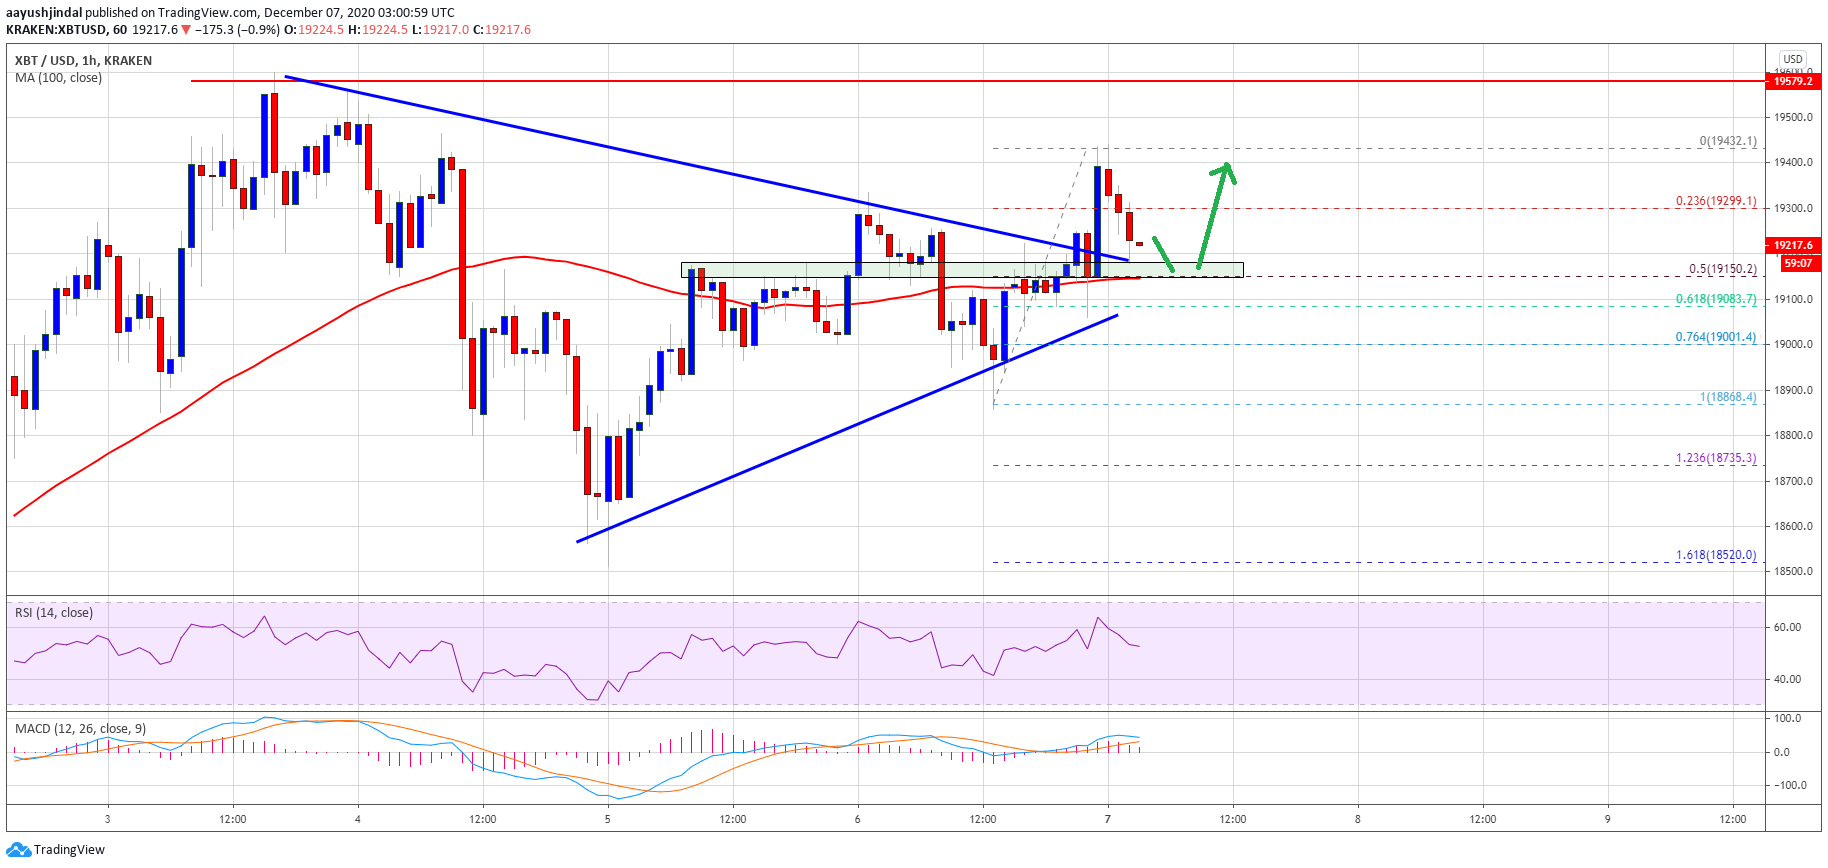
Source: BTCUSD on TradingView.com
The price is now approaching the $19,150 support and the 100 hourly simple moving average. The broken trend line at $19,150 and the 100 hourly simple moving average are providing support.
The 50% Fib retracement level of the recent wave from the $18,868 low to $19,432 high is also near the $19,150 level. As long as the price is above $19,150 and the 100 hourly SMA, it could attempt another upside break. The main resistance is still near $19,500, above which the price may possibly test $20,000.
Downside Break in BTC?
If bitcoin fails to stay above the $19,150 support and the 100 hourly simple moving average, it could decline sharply. An initial support is near the $19,000 level.
A proper close below the $19,000 support might increase pressure on the bulls and the bears are likely to gain traction. The next major support sits near the $18,500 level.
Technical indicators:
Hourly MACD – The MACD is slowly gaining momentum in the bearish zone.
Hourly RSI (Relative Strength Index) – The RSI for BTC/USD is currently just above the 50 level.
Major Support Levels – $19,150, followed by $19,000.
Major Resistance Levels – $19,400, $19,500 and $19,800.