
Reason to trust
How Our News is Made
Strict editorial policy that focuses on accuracy, relevance, and impartiality
Ad discliamer
Morbi pretium leo et nisl aliquam mollis. Quisque arcu lorem, ultricies quis pellentesque nec, ullamcorper eu odio.
Bitcoin remained well bid above the $49,000 support against the US Dollar. BTC could start a fresh increase if it clears the $50,800 resistance zone.
- Bitcoin is showing a few positive signs above the $49,000 support zone.
- The price is now trading above $49,500 and the 100 hourly simple moving average.
- There is a key bearish trend line forming with resistance near $50,500 on the hourly chart of the BTC/USD pair (data feed from Kraken).
- The pair could start a fresh increase if it is above the $49,000 level.
Bitcoin Price Aims Fresh Increase
Bitcoin price corrected below the $50,000 support level from the $52,000 resistance zone. BTC broke the $49,500 support level, but the bulls were active above the $49,000 level.
The last swing high was formed near $51,955 before there was a downside correction. The price traded below the 50% Fib retracement level of the recent increase from the $47,210 swing low to $51,955 high. Bitcoin price also spiked below the $49,500 support and the 100 hourly simple moving average.
However, it was stable near the $49,000 level. The 61.8% Fib retracement level of the recent increase from the $47,210 swing low to $51,955 high also acted as a support.
The price is now trading above $49,500 and the 100 hourly simple moving average. An immediate resistance on the upside is near the $50,400 level. The next major resistance is near the $50,500 level. There is also a key bearish trend line forming with resistance near $50,500 on the hourly chart of the BTC/USD pair.
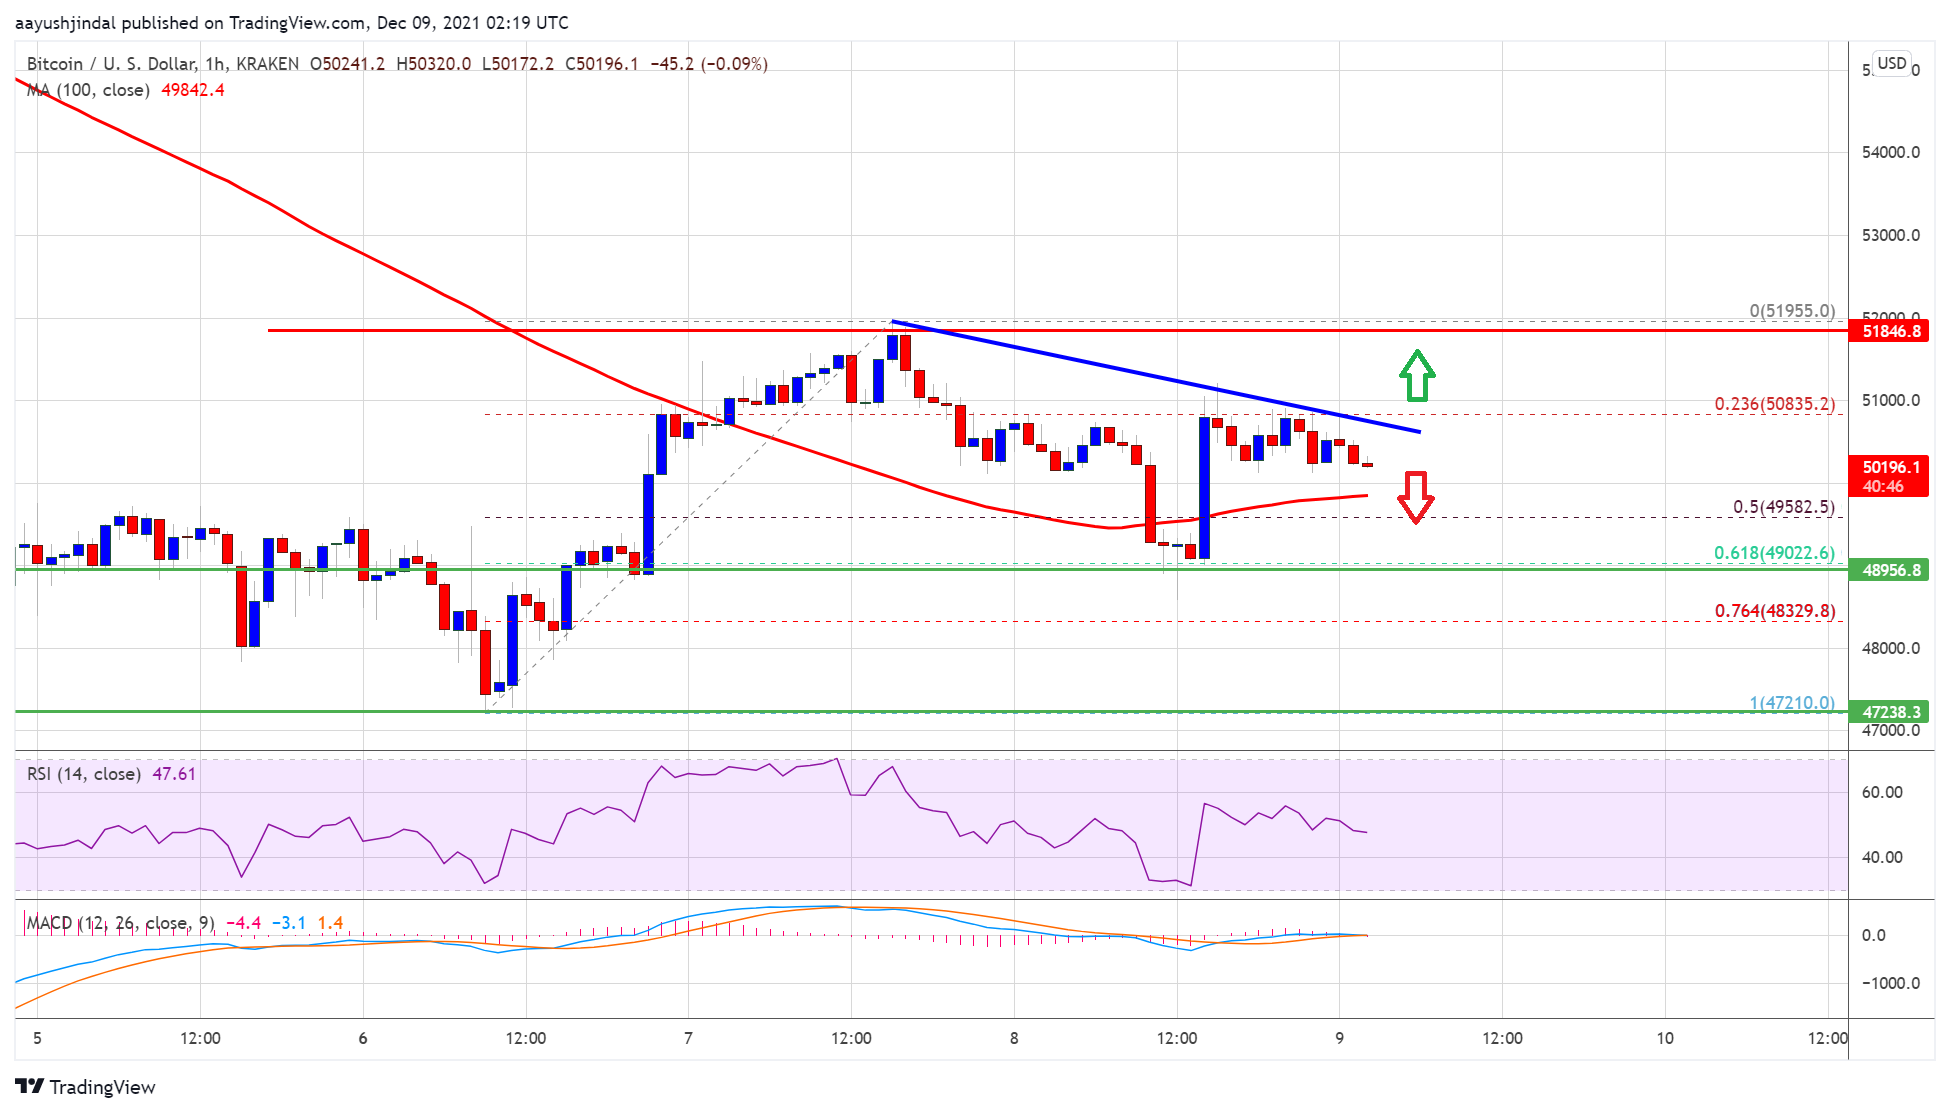
Source: BTCUSD on TradingView.com
A clear break above the $50,500 resistance zone could open the doors for more upsides. The next key resistance is near the $52,000 level, above which the price may possibly start a major increase.
More Losses In BTC?
If bitcoin fails to clear the $50,500 resistance zone, it could continue to move down. An immediate support on the downside is near the $50,000 level and the 100 hourly SMA.
The first major support is now forming near the $49,000 level. A downside break below the $49,000 support may perhaps increase selling pressure. The next stop for the bears might be $47,200.
Technical indicators:
Hourly MACD – The MACD is slowly losing pace in the bearish zone.
Hourly RSI (Relative Strength Index) – The RSI for BTC/USD is currently near the 50 level.
Major Support Levels – $50,000, followed by $49,000.
Major Resistance Levels – $50,500, $52,000 and $53,500.