
Reason to trust
How Our News is Made
Strict editorial policy that focuses on accuracy, relevance, and impartiality
Ad discliamer
Morbi pretium leo et nisl aliquam mollis. Quisque arcu lorem, ultricies quis pellentesque nec, ullamcorper eu odio.
Bitcoin price failed to clear the $58,500 resistance against the US Dollar. BTC is correcting lower and it could decline heavily if there is a break below $55,500
- Bitcoin struggled to clear the $58,500 resistance and started a fresh decline.
- The price is now trading below the $57,000 level and the 100 hourly simple moving average.
- There is a key rising channel forming with support near $56,000 on the hourly chart of the BTC/USD pair (data feed from Kraken).
- The pair could decline heavily if there is a close below $56,000 and $55,500.
Bitcoin Price is Testing Key Support
Bitcoin climbed again above the $58,000 level, but the bulls struggled to remain in action. BTC formed a short-term top near the $58,500 level and it recently started a downward move.
There was a break below the $57,000 and $56,000 levels. The price even spiked below the $55,500 support level and a low is formed near $55,294. It is now trading below the $57,000 level and the 100 hourly simple moving average.
Bitcoin is attempting a recovery above the $56,000 level. It broke the 23.6% Fib retracement level of the recent decline from the $58,418 high to $55,294 low. There is also a key rising channel forming with support near $56,000 on the hourly chart of the BTC/USD pair.
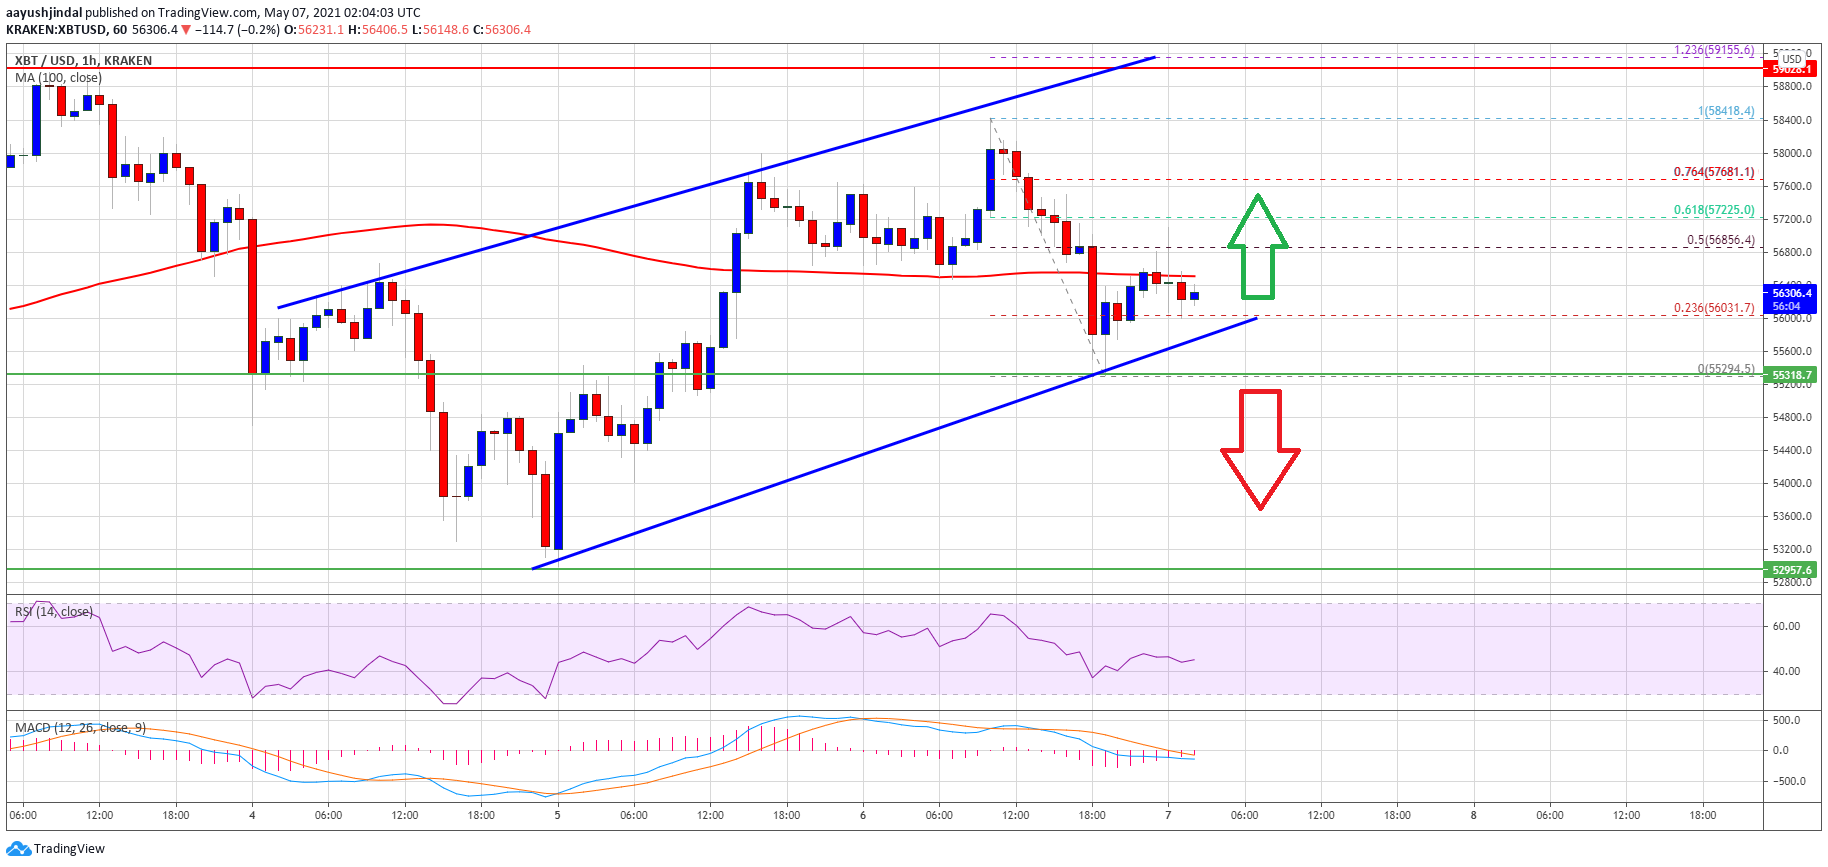
Source: BTCUSD on TradingView.com
It is now facing resistance near the $56,500 level and the 100 hourly simple moving average. The next resistance sits near the $56,800 level. It is close to the 50% Fib retracement level of the recent decline from the $58,418 high to $55,294 low.
If there is an upside break above the $56,800 and $57,000 levels, the price could rise further. The next key resistance is near the $58,500 level.
More Losses in BTC?
If bitcoin fails to clear the $56,500 resistance or $56,800, it could continue to move down. An initial support on the downside is near the $56,000 level and the channel zone.
The first key support is near the $55,250 level, below which the price might test $55,000. Any more losses could open the doors for a drop towards the $52,500 level in the near term.
Technical indicators:
Hourly MACD – The MACD is struggling to move into the bullish zone.
Hourly RSI (Relative Strength Index) – The RSI for BTC/USD is now just below the 50 level.
Major Support Levels – $56,000, followed by $55,250.
Major Resistance Levels – $56,800, $58,500 and $60,000.