
Reason to trust
How Our News is Made
Strict editorial policy that focuses on accuracy, relevance, and impartiality
Ad discliamer
Morbi pretium leo et nisl aliquam mollis. Quisque arcu lorem, ultricies quis pellentesque nec, ullamcorper eu odio.
Bitcoin price is trading below the $48,000 resistance zone against the US Dollar. BTC could decline heavily if it fails to stay above the $46,500 support zone.
- Bitcoin failed to surpass $48,250 and dropped back to $46,500.
- The price is now trading well below $48,000 and the 100 hourly simple moving average.
- There is a key bearish trend line forming with resistance near $47,850 on the hourly chart of the BTC/USD pair (data feed from Kraken).
- The pair could accelerate further lower if there is a break below the $46,500 support zone.
Bitcoin Price Tests Key Support
Bitcoin price attempted an upside break above the $48,000 resistance zone. However, BTC remained below the 100 hourly simple moving average and topped near the $48,250 level.
A high was formed near $48,245 and the price started another decline. It broke the $47,500 and $47,000 support levels. It traded close to the $46,500 support zone and a low is formed near $46,540. It is now consolidating losses near the 23.6% Fib retracement level of the recent decline from the $48,245 swing high to $46,540 low.
Besides, bitcoin is now trading well below $48,000 and the 100 hourly simple moving average. On the downside, there is a key support forming near the $46,500 zone.
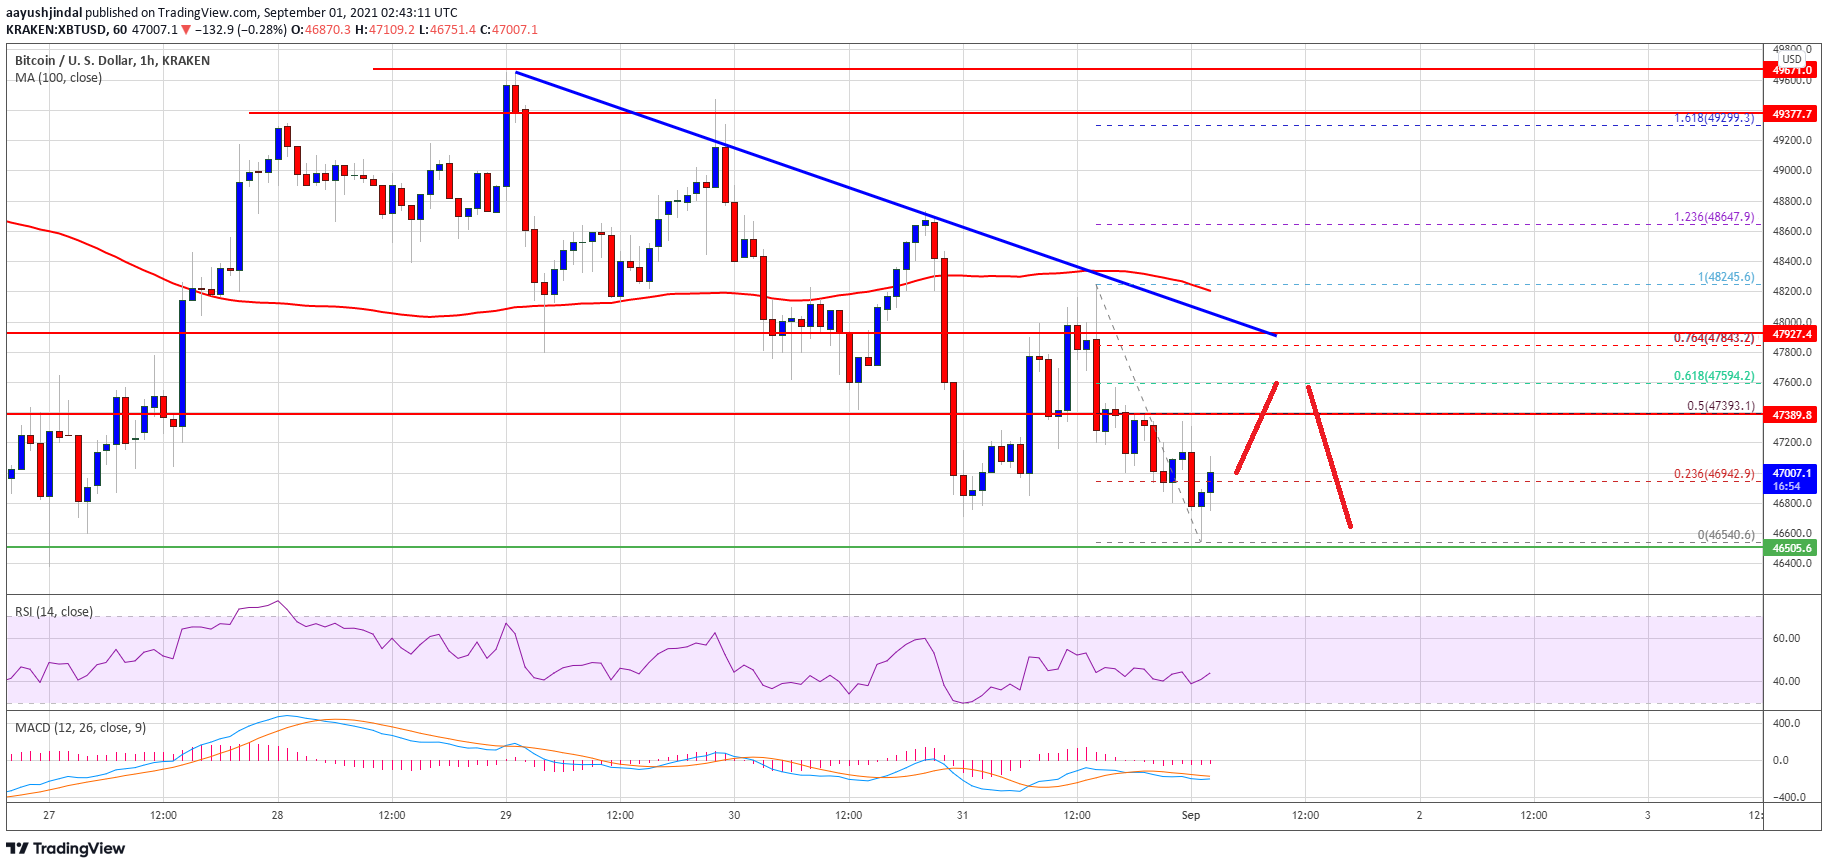
Source: BTCUSD on TradingView.com
If there is a downside break below the $46,500 support zone, the price might accelerate lower. The next major support is near the $45,500 level, below which the price could revisit $45,000. Any more downsides may possibly set the pace for a larger decline towards $42,000.
Fresh Increase In BTC?
If bitcoin stays above the $46,500 support zone, it could start a fresh increase. An immediate resistance on the upside is near the $47,200 level. The first major resistance is near the $47,400 level. It is close to the 50% Fib retracement level of the recent decline from the $48,245 swing high to $46,540 low.
The main resistance is near the $48,000 level and the 100 hourly simple moving average. A clear break above the $48,000 level could clear the path for a decent increase in the near term.
Technical indicators:
Hourly MACD – The MACD is gaining pace in the bearish zone.
Hourly RSI (Relative Strength Index) – The RSI for BTC/USD is well below the 50 level.
Major Support Levels – $46,500, followed by $45,000.
Major Resistance Levels – $47,200, $47,400 and $48,000.


