
Reason to trust
How Our News is Made
Strict editorial policy that focuses on accuracy, relevance, and impartiality
Ad discliamer
Morbi pretium leo et nisl aliquam mollis. Quisque arcu lorem, ultricies quis pellentesque nec, ullamcorper eu odio.
Bitcoin price traded to a new monthly high at $13,352 before correcting lower against the US Dollar. BTC is currently trading nicely above the 100 hourly SMA and it could attempt another increase.
- Bitcoin is trading nicely above the $12,800 and $13,000 support levels.
- The price is holding gains above the 100 hourly simple moving average, with a positive angle above towards $13,300.
- There is a crucial bullish trend line forming with support near $12,900 on the hourly chart of the BTC/USD pair (data feed from Kraken).
- The pair is likely to continue higher as long as it is above the 100 hourly SMA and $12,800.
Bitcoin Price Is Showing Positive Signs
Bitcoin price remained well bid above the 13,000 resistance and extended its rise. BTC even broke the last high at $13,250 and traded to a new monthly high at $13,352.
Recently, there was a downside correction and the price broke the $13,000 support. The decline found support near the $12,800 zone and the 100 hourly simple moving average. There is also a crucial bullish trend line forming with support near $12,900 on the hourly chart of the BTC/USD pair.
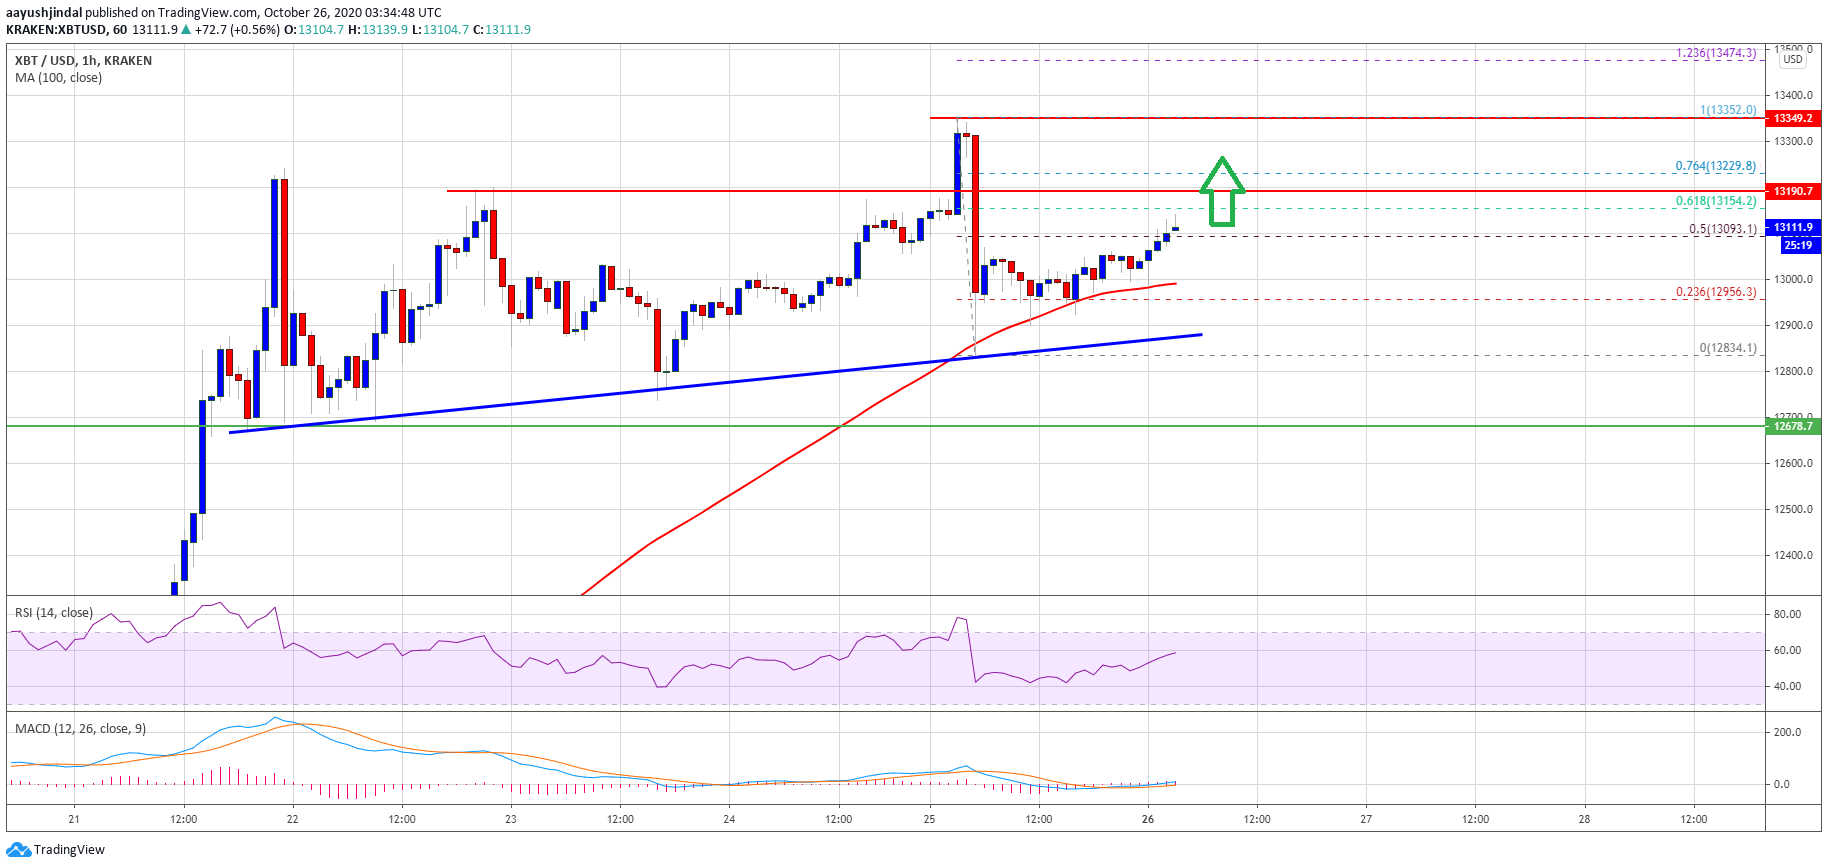
Source: BTCUSD on TradingView.com
Bitcoin is currently rising and trading above the $13,000 level. There was a break above the 50% Fib retracement level of the recent decline from the $13,352 high to $12,834 low.
An immediate resistance is near the $13,150 level. It is close to the 61.8% Fib retracement level of the recent decline from the $13,352 high to $12,834 low. To continue higher, BTC must gain momentum above the $13,200 level.
If there is a daily close above the $13,200 level, the price is likely to accelerate higher above $13,350. The next major resistance on the upside is near the $13,500 level.
Downside Break in BTC?
If bitcoin fails to climb above the $13,150 and $13,200 resistance levels, there could be a fresh decline. The first major support is near the 100 hourly SMA at $13,000.
The main support is near the trend line at $12,900, below which the bulls might even struggle to protect the $12,800 support level in the coming sessions.
Technical indicators:
Hourly MACD – The MACD is slowly gaining momentum in the bullish zone.
Hourly RSI (Relative Strength Index) – The RSI for BTC/USD is now well above the 50 level, with a positive angle.
Major Support Levels – $13,000, followed by $12,900.
Major Resistance Levels – $13,150, $13,200 and $13,500.


