
Reason to trust
How Our News is Made
Strict editorial policy that focuses on accuracy, relevance, and impartiality
Ad discliamer
Morbi pretium leo et nisl aliquam mollis. Quisque arcu lorem, ultricies quis pellentesque nec, ullamcorper eu odio.
Bitcoin price surged above $11,000 and $11,200 against the US Dollar. BTC is now consolidating gains and it seems to be preparing for another rally above $11,500.
- Bitcoin is showing positive signs and it is trading nicely above the $11,200 support level.
- The price is facing a short-term resistance at $11,420, but it is above the 100 hourly simple moving average.
- There is a key contracting triangle forming with resistance near $11,420 on the hourly chart of the BTC/USD pair (data feed from Kraken).
- The pair could rally if it clears the $11,420 and $11,500 resistance levels.
Bitcoin Price is Showing Positive Signs
Bitcoin price started a strong upward move after it broke the $11,000 resistance against the US Dollar. BTC even cleared the $11,200 resistance and settled well above the 100 hourly simple moving average.
It traded to a new monthly high near $11,495 before starting a short-term downside correction. There was a break below the $11,400 level, plus the price traded below the 23.6% Fib retracement level of the upward move from the $11,025 low to $11,494 high.
However, the bulls were able to protect the $11,250 support level. The 50% Fib retracement level of the upward move from the $11,025 low to $11,494 high also acted as a strong support.
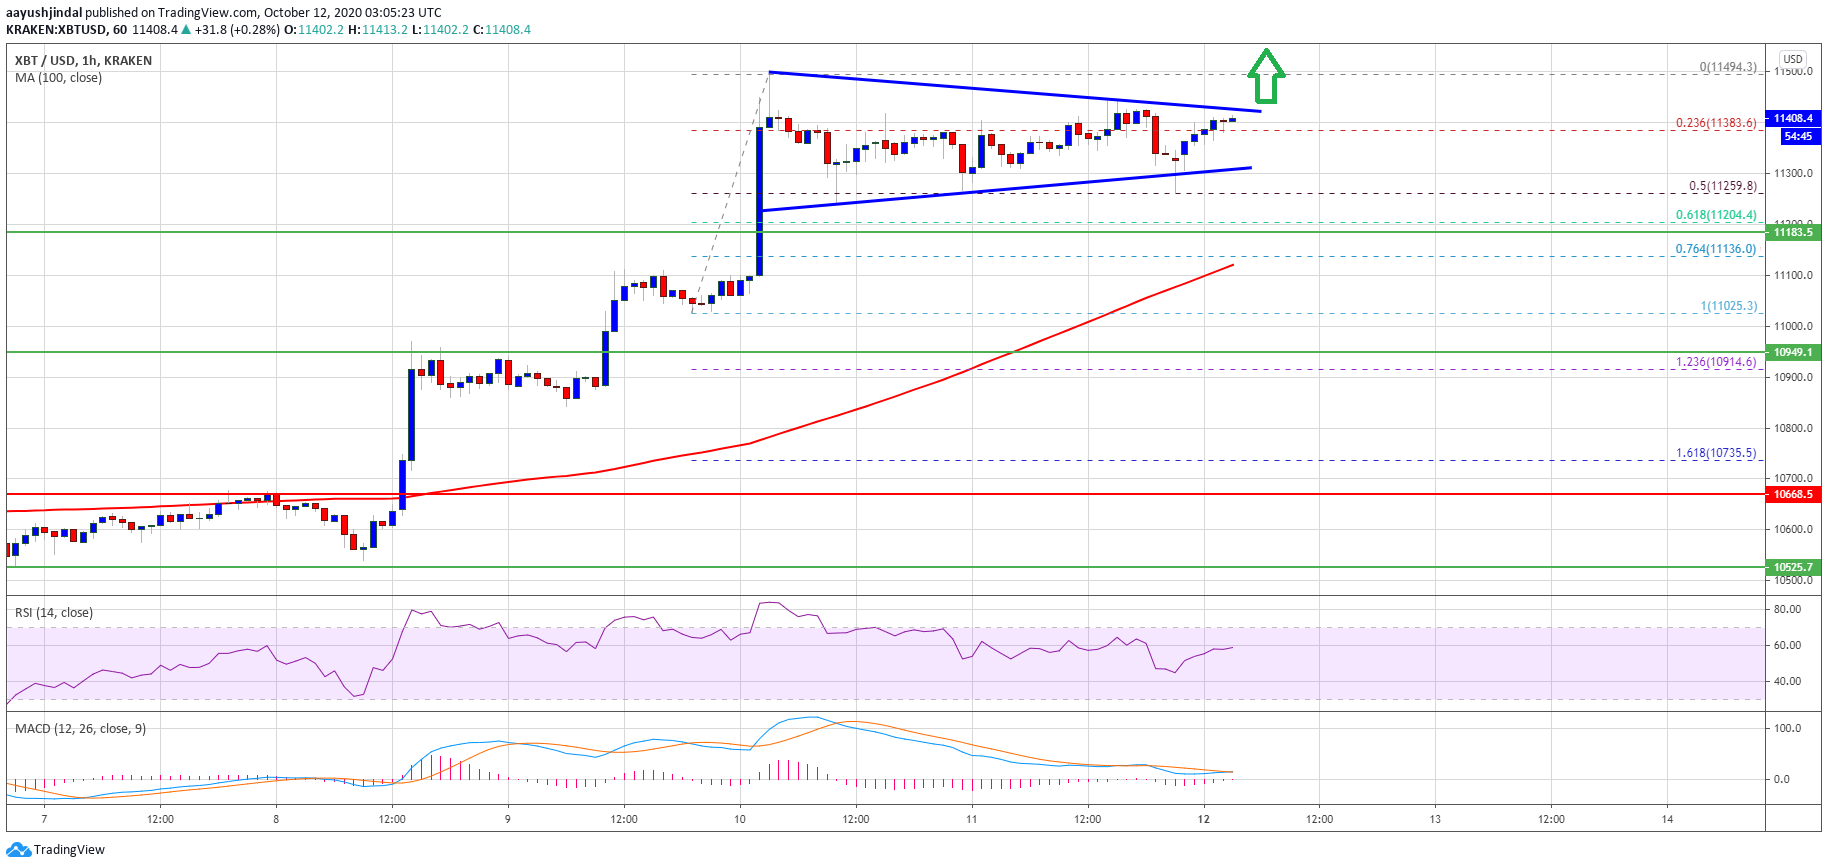
Bitcoin price settles above $11,250. Source: TradingView.com
It seems like there is a key contracting triangle forming with resistance near $11,420 on the hourly chart of the BTC/USD pair. The pair is currently trading near the triangle resistance and attempting an upside break above $11,400.
If there is a clear break above the $11,420 level, the price could even surpass the $11,500 resistance. In the stated case, there are chances of a fresh rally and the price could rise towards the $12,000 level in the near term.
Dips Now Supported in BTC?
Bitcoin is likely to find support near the $11,250 and $11,200 levels. If there is a downside break below the triangle support, there are chances of a larger correction below $11,200.
The next major support is near the $11,120 level or the 100 hourly simple moving average. The main support is likely forming near $11,000 (the last breakout zone).
Technical indicators:
Hourly MACD – The MACD is about to gain pace in the bullish zone.
Hourly RSI (Relative Strength Index) – The RSI for BTC/USD is currently well above the 50 level.
Major Support Levels – $11,250, followed by $11,200.
Major Resistance Levels – $11,400, $11,420 and $11,500.