
Reason to trust
How Our News is Made
Strict editorial policy that focuses on accuracy, relevance, and impartiality
Ad discliamer
Morbi pretium leo et nisl aliquam mollis. Quisque arcu lorem, ultricies quis pellentesque nec, ullamcorper eu odio.
Bitcoin started a fresh increase above the $43,500 resistance against the US Dollar. BTC is showing positive signs and might even surge above $45,000.
- Bitcoin started a fresh increase after it broke the $43,500 resistance zone.
- The price is trading above $43,500 and the 100 hourly simple moving average.
- There is a crucial bullish trend line forming with support near $43,300 on the hourly chart of the BTC/USD pair (data feed from Kraken).
- The pair could continue to rise and might even clear the $45,000 resistance zone.
Bitcoin Price Remains Supported
Bitcoin price remained well bid above the $42,500 zone. BTC formed a base and started a fresh increase above the $43,000 resistance zone.
The upward move was such that the bulls were able to pump the price above the $43,500 resistance zone. It even cleared the $44,000 level and settled above the 100 hourly simple moving average. A high was formed near $44,381 and the price is now consolidating gains.
It is trading near the 23.6% Fib retracement level of the recent rise from the $42,637 swing low to $44,381 high. However, it is well above $43,500 and the 100 hourly simple moving average.
Besides, there is a major bullish trend line forming with support near $42,300 on the hourly chart of the BTC/USD pair. On the upside, the price is facing resistance near the $44,300 level. The next major resistance could be near the $44,500 zone.
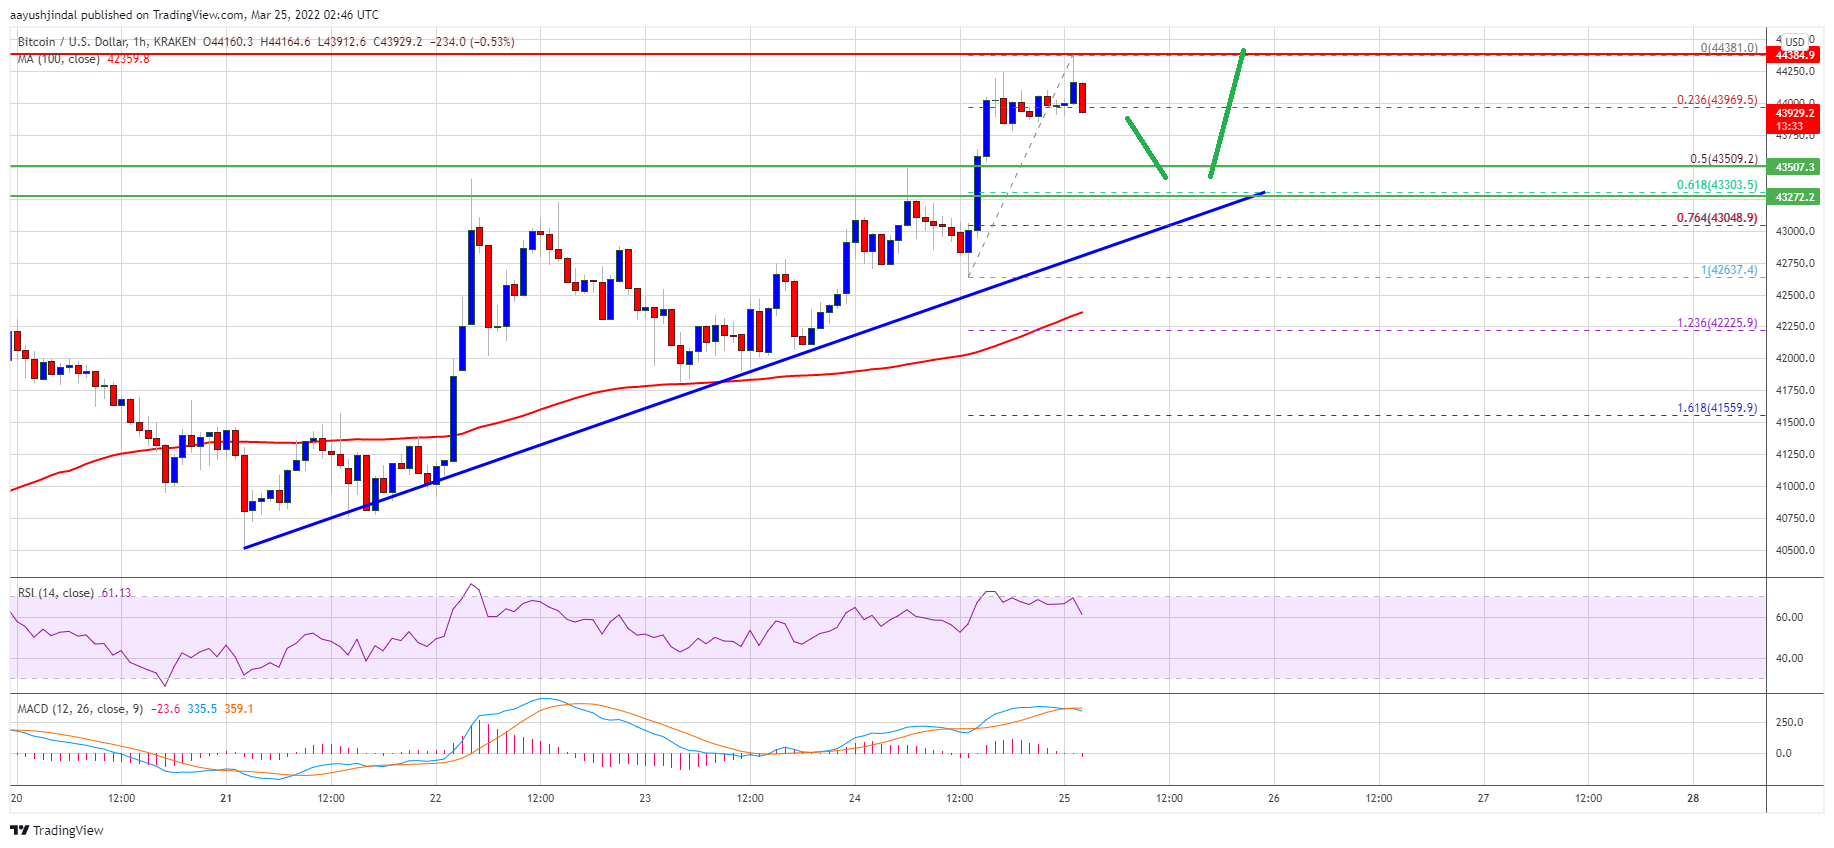
Source: BTCUSD on TradingView.com
If the bulls remain in action, bitcoin price might even rise towards the $45,000 resistance. A successful break and close above the $45,000 level might spark sharp gains. In the stated case, the price might rise towards the $46,500 level.
Dips Supported in BTC?
If bitcoin fails to clear the $44,500 resistance zone, it could start a downside correction. An immediate support on the downside is near the $43,500 zone. The 50% Fib retracement level of the recent rise from the $42,637 swing low to $44,381 high is also near $43,500.
The next major support is seen near the trend line and $43,300 and the trend line. A downside break below the $43,300 support zone could start a drop towards the $42,500 support.
Technical indicators:
Hourly MACD – The MACD is slowly moving in the bearish zone.
Hourly RSI (Relative Strength Index) – The RSI for BTC/USD is now above the 60 level.
Major Support Levels – $43,500, followed by $43,300.
Major Resistance Levels – $44,300, $44,500 and $45,000.