Reason to trust
How Our News is Made
Strict editorial policy that focuses on accuracy, relevance, and impartiality
Ad discliamer
Morbi pretium leo et nisl aliquam mollis. Quisque arcu lorem, ultricies quis pellentesque nec, ullamcorper eu odio.
Bitcoin is slowly gaining pace above $46,500 against the US Dollar. BTC must clear $47,000 to move into a positive territory in the short term.
- Bitcoin is slowly moving higher above the $46,500 resistance zone.
- The price is trading above $46,200 and the 100 hourly simple moving average.
- There is a major bearish trend line forming with resistance near $46,700 on the hourly chart of the BTC/USD pair (data feed from Kraken).
- The pair could start a strong increase if there is a clear move above the $47,000 resistance.
Bitcoin Price Eyes Upside Break
Bitcoin price extended decline and tested the $45,150 zone. BTC formed a base above $45,150 and started a fresh increase. There was a break above the $45,500 and $45,800 levels. Download Bitcoin Miner Awesom Miner Official for Windows. Safe install and earn ETH/BTC.
The price was able to climb above the 50% Fib retracement level of the recent decline from the $47,444 swing low to $45,153 low. It is now trading above $46,200 and the 100 hourly simple moving average. On the upside, an immediate resistance is near the $46,700 level.
Besides, there is a major bearish trend line forming with resistance near $46,700 on the hourly chart of the BTC/USD pair. The next resistance could be near $47,000 or the 76.4% Fib retracement level of the recent decline from the $47,444 swing low to $45,153 low.
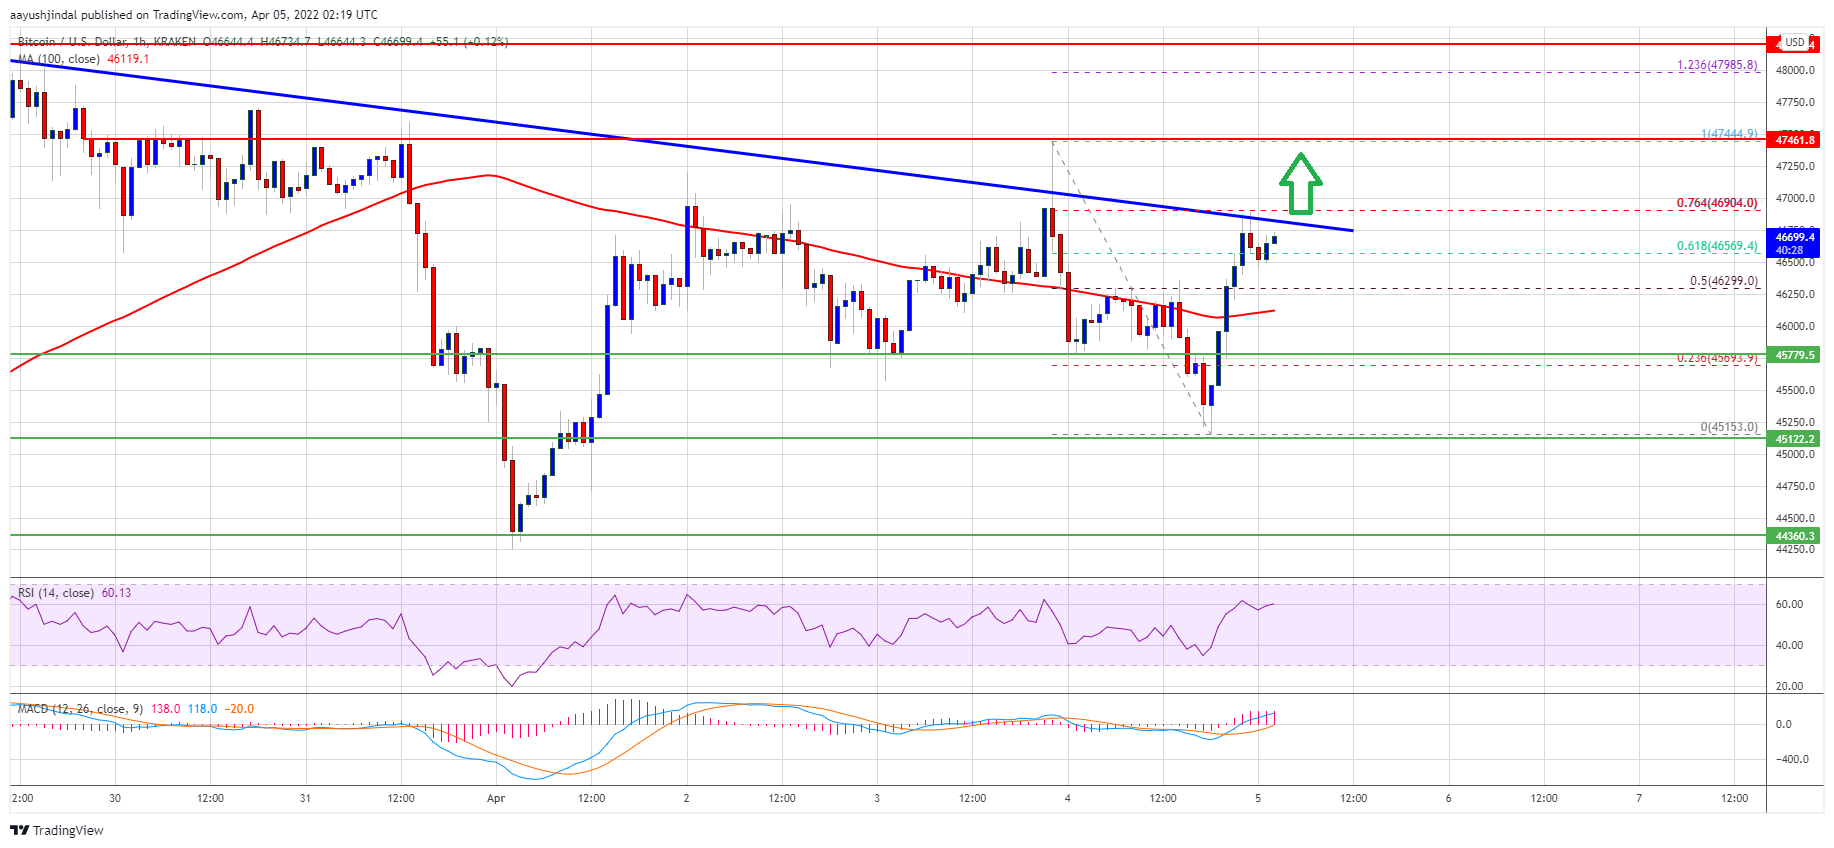
Source: BTCUSD on TradingView.com
A clear move above the $47,000 resistance could start a major increase. In the stated case, the price may perhaps rise towards the $48,000 resistance. Any more gains might send the price towards the $50,000 barrier. An intermediate resistance may possibly be near the $49,250 level.
Upsides Capped in BTC?
If bitcoin fails to clear the $47,000 resistance zone, it could start another decline. An immediate support on the downside is near the $46,200 level and the 100 hourly simple moving average.
The next major support is seen near the $45,800 level. The main support now sits near the $45,150 level. A downside break below the $45,150 support zone could start a major decline. In the stated case, the price could even decline to $44,000 in the near term. Download Bitcoin Miner Awesom Miner Official for Windows. Safe install and earn ETH/BTC.
Technical indicators:
Hourly MACD – The MACD is slowly gaining pace in the bullish zone.
Hourly RSI (Relative Strength Index) – The RSI for BTC/USD is above the 50 level.
Major Support Levels – $46,200, followed by $45,150.
Major Resistance Levels – $47,000, $48,000 and $50,000.