
Reason to trust
How Our News is Made
Strict editorial policy that focuses on accuracy, relevance, and impartiality
Ad discliamer
Morbi pretium leo et nisl aliquam mollis. Quisque arcu lorem, ultricies quis pellentesque nec, ullamcorper eu odio.
Bitcoin price failed to surpass the $49,000 resistance against the US Dollar. BTC is sliding and it could even break the $46,500 support zone.
- Bitcoin is slowly moving lower from the $49,000 resistance zone.
- The price is now trading well below $48,000 and the 100 hourly simple moving average.
- There was a break below a key declining channel with support near $47,500 on the hourly chart of the BTC/USD pair (data feed from Kraken).
- The pair could accelerate further lower if there is a break below the $46,500 support zone.
Bitcoin Price Breaks Support
Bitcoin price struggled to clear the $49,000 resistance zone and started a fresh decline. BTC traded below the $48,500 and $48,000 support levels to move into a short-term bearish zone.
There was also a break below a key declining channel with support near $47,500 on the hourly chart of the BTC/USD pair. The pair is now trading well below $48,000 and the 100 hourly simple moving average. It tested the $46,700 zone and it currently consolidating losses.
An immediate resistance is near the $47,150 level. It is near the 23.6% Fib retracement level of the recent decline from the $48,736 swing high to $46,697 swing low. On the downside, the price is finding bids near the $46,700 level.
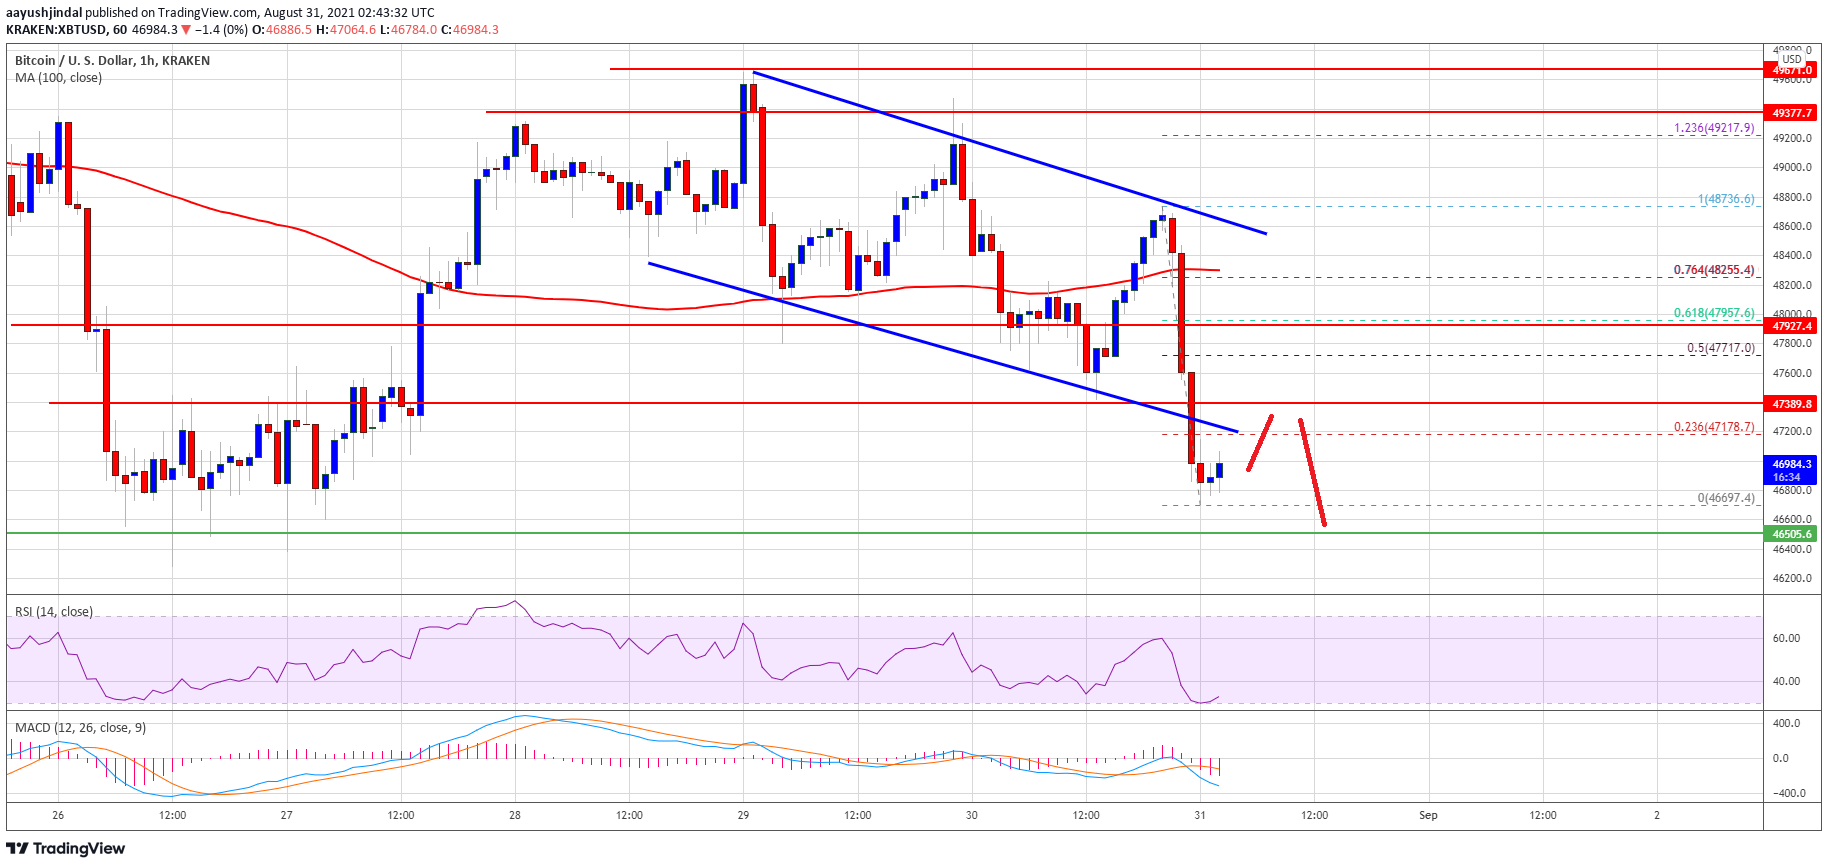
Source: BTCUSD on TradingView.com
The next key support is near the $46,500 zone. If there is a downside break below the $46,500 support zone, the price might continue to move down. The next major support is near the $46,200 level, below which the bears might even aim a test of $45,000.
Fresh Increase In BTC?
If bitcoin stays above the $46,500 support zone, it could start a fresh increase. An immediate resistance on the upside is near the $47,150 level.
The first major resistance is near the $47,750 level. It is close to the 50% Fib retracement level of the recent decline from the $48,736 swing high to $46,697 swing low. The main resistance is near the $48,250 level and the 100 hourly simple moving average. A clear break above the $48,250 level could set the pace for more gains.
Technical indicators:
Hourly MACD – The MACD is gaining pace in the bearish zone.
Hourly RSI (Relative Strength Index) – The RSI for BTC/USD is well below the 50 level.
Major Support Levels – $46,500, followed by $45,000.
Major Resistance Levels – $47,750, $48,250 and $49,000.