
Reason to trust
How Our News is Made
Strict editorial policy that focuses on accuracy, relevance, and impartiality
Ad discliamer
Morbi pretium leo et nisl aliquam mollis. Quisque arcu lorem, ultricies quis pellentesque nec, ullamcorper eu odio.
Bitcoin price rallied over 6% and it broke the $17,500 resistance against the US Dollar. BTC is consolidating gains and it seems like the bulls are aiming more upsides above $18,000.
- Bitcoin extended its rise above the $17,200 and $17,500 resistance levels.
- The price traded to a new monthly high at $17,895 and settled above the 100 hourly simple moving average.
- There is a key contracting triangle forming with resistance near $17,800 on the hourly chart of the BTC/USD pair (data feed from Kraken).
- The pair remains well supported and it is likely to rally further above the $18,000 resistance.
Bitcoin Price Gains 6%
After a sharp rise above the $17,000 resistance, bitcoin price started following a bullish path. BTC even surged above the $17,200 level to move further into a positive zone.
The price rallied over 6%, broke the $17,500 resistance, and settled well above the 100 hourly simple moving average. Bitcoin traded to a new monthly high at $17,895 and it is currently consolidating gains.
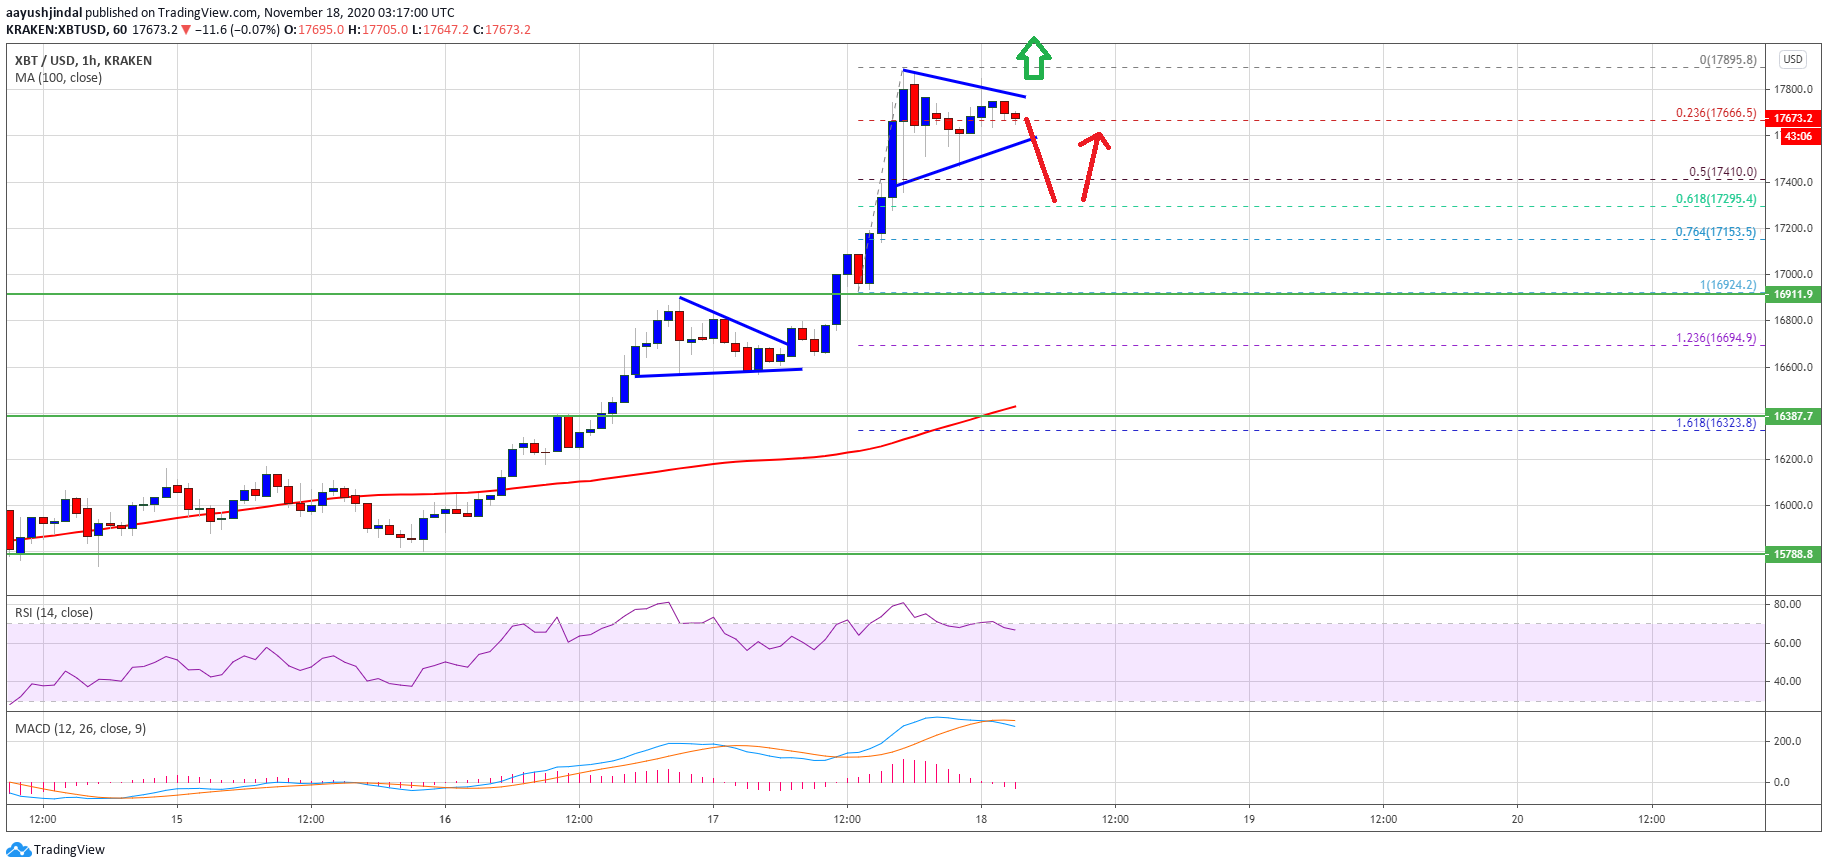
Source: BTCUSD on TradingView.com
It corrected below the 23.6% Fib retracement level of the recent surge from the $16,924 swing low to $17,895 high. However, the price remained well supported above the $17,500 level. It seems like there is a key contracting triangle forming with resistance near $17,800 on the hourly chart of the BTC/USD pair.
If there is a fresh break above the triangle resistance at $17,800, the price could rally further. The next major resistance is near the $18,000 level. Any further gains could open the doors for a rise towards the $18,400 level in the near term. An intermediate resistance sits near the $18,250 level.
Dips Supported in BTC?
If bitcoin fails to clear the triangle resistance or $17,850, there could be a short-term downside correction. An initial support is near the triangle support at $17,580.
The next major support is near the $17,410 level. It is close to the 50% Fib retracement level of the recent surge from the $16,924 swing low to $17,895 high. Any further losses may perhaps lead the price towards the $17,200 support level.
Technical indicators:
Hourly MACD – The MACD is slowly losing momentum in the bullish zone.
Hourly RSI (Relative Strength Index) – The RSI for BTC/USD is currently correcting lower, but it is well above the 60 level.
Major Support Levels – $17,580, followed by $17,400.
Major Resistance Levels – $17,800, $17,850 and $18,000.


