
Reason to trust
How Our News is Made
Strict editorial policy that focuses on accuracy, relevance, and impartiality
Ad discliamer
Morbi pretium leo et nisl aliquam mollis. Quisque arcu lorem, ultricies quis pellentesque nec, ullamcorper eu odio.
Bitcoin price settled below $46,000 and declined heavily against the US Dollar. BTC even traded close to $40,000 before starting an upside correction.
- Bitcoin is down over 10% and it broke the $45,000 and $43,000 support levels.
- The price is now trading below $43,000 and the 100 hourly simple moving average.
- There is a major bearish trend line forming with resistance near $43,100 on the hourly chart of the BTC/USD pair (data feed from Kraken).
- The pair could resume its decline if it fails to recover above the $43,000 zone.
Bitcoin Price Corrects Losses
Bitcoin price failed to stay above the $46,000 support zone. As a result, there was a sharp decline in BTC below the $45,000 level (as discussed yesterday).
The price broke many support zones near $44,000 and $43,000 to enter a bearish zone. The decline gained below $42,000 and the price settled below the 100 hourly simple moving average. It traded close to $40,000 and a low was formed near $40,200.
Bitcoin is now correcting higher and it broke the $41,500 level. The price was able to surpass the 50% Fib retracement level of the recent drop from the $44,250 swing high to $40,200 low.
An immediate resistance on the upside is near the $43,000 level. The first major resistance sits near the $43,100 level. There is also a major bearish trend line forming with resistance near $43,100 on the hourly chart of the BTC/USD pair.
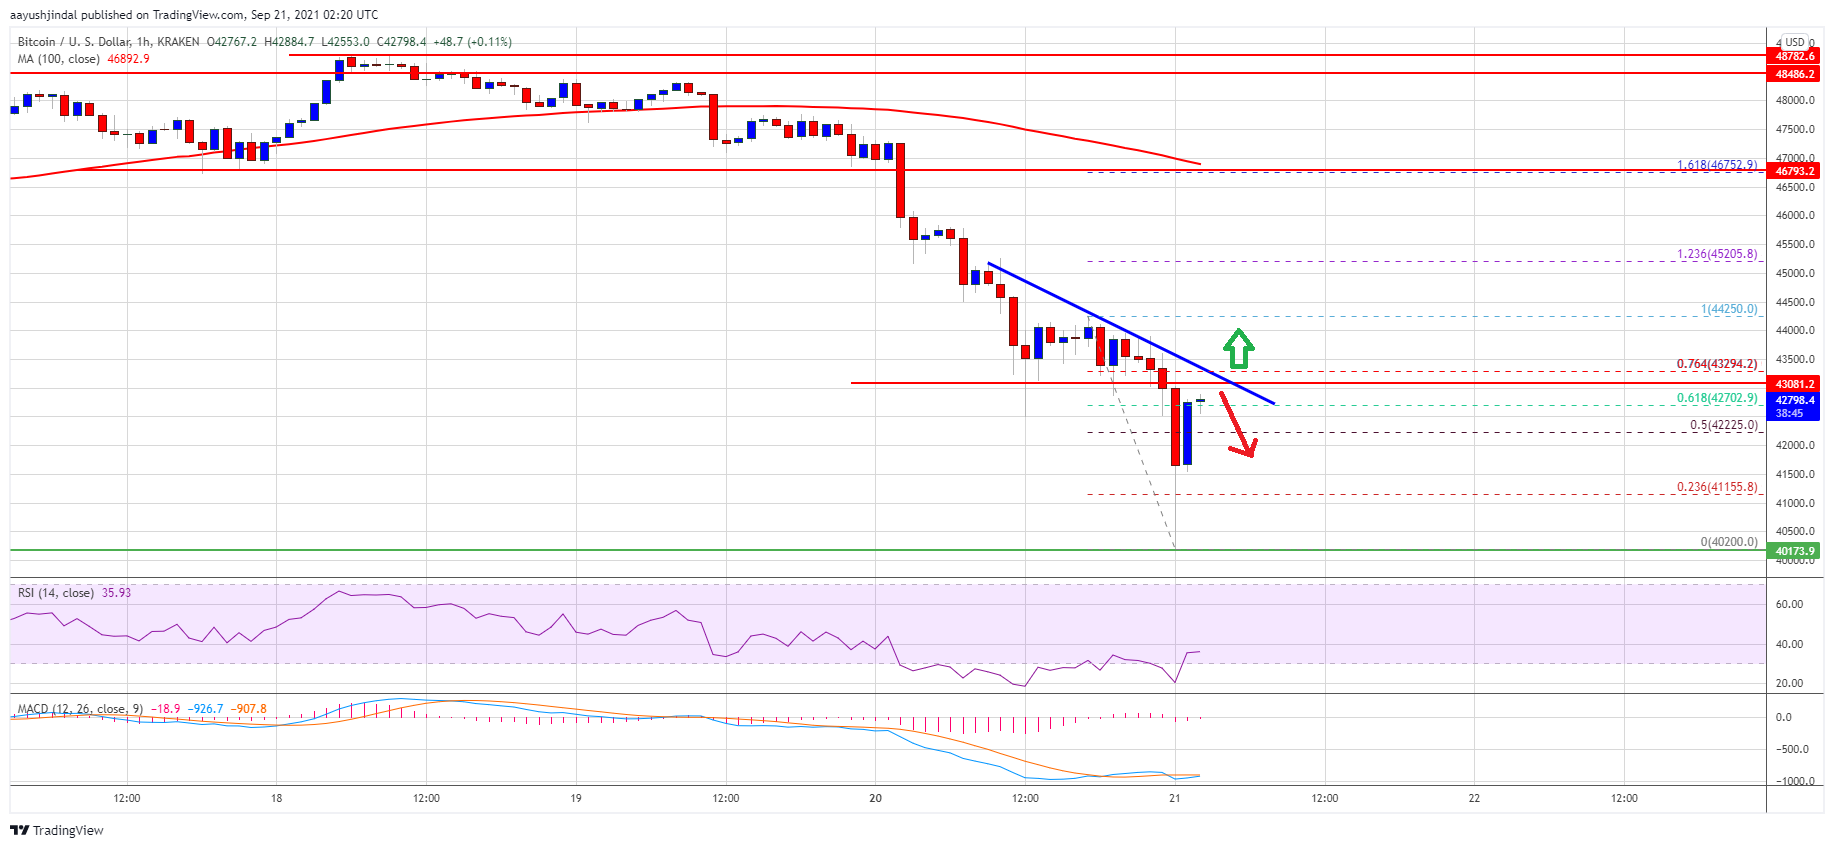
Source: BTCUSD on TradingView.com
The trend line is close to the 76.4% Fib retracement level of the recent drop from the $44,250 swing high to $40,200 low. To start a strong recovery, the price must clear the $43,100 resistance. The next major resistance is near the $44,000 zone, above which the price could revisit the $45,000 resistance.
More Losses In BTC?
If bitcoin fails to clear the $43,100 resistance zone, it could resume its decline. An immediate support on the downside is near the $42,200 level.
The next major support is near the $41,500 zone. A downside break below the $41,500 zone could trigger a fresh decline towards the $40,500 level or even $40,000.
Technical indicators:
Hourly MACD – The MACD is slowly gaining pace in the bullish zone.
Hourly RSI (Relative Strength Index) – The RSI for BTC/USD is still well below the 50 level.
Major Support Levels – $41,500, followed by $40,500.
Major Resistance Levels – $43,000, $43,100 and $44,000.


