
Reason to trust
How Our News is Made
Strict editorial policy that focuses on accuracy, relevance, and impartiality
Ad discliamer
Morbi pretium leo et nisl aliquam mollis. Quisque arcu lorem, ultricies quis pellentesque nec, ullamcorper eu odio.
Bitcoin price started a fresh increase above the $40,000 resistance zone against the US Dollar. BTC tested the $45,000 resistance zone before it started a downside correction.
- Bitcoin gained traction above the $40,000 and $43,500 resistance levels.
- The price is now trading above $42,000 and the 100 hourly simple moving average.
- There was a break below a key bullish trend line with support near $44,500 on the hourly chart of the BTC/USD pair (data feed from Kraken).
- The pair is correcting gains, but the bulls are likely to remain active near $42,000.
Bitcoin Price Remains Supported
Bitcoin price started a strong rally above the $40,000 resistance, after ethereum’s surge. BTC surpassed the $41,200 resistance zone to move into a positive zone.
There was a clear break above the $42,000 barrier and a close above the 100 hourly simple moving average. Finally, there was a break above the $43,500 resistance zone. The pair tested the $45,000 resistance and a high was formed near $45,339.
Recently, there was a downside correction below $45,000. The pair traded below the $44,000 support zone. There was also a break below a key bullish trend line with support near $44,500 on the hourly chart of the BTC/USD pair.
The pair traded below the 23.6% Fib retracement level of the recent rally from the $37,365 swing low to $45,339 high. It is now consolidating near the $43,000 support zone. On the upside, an initial resistance is near the $44,000 level. The first key resistance is near the $45,000 level.
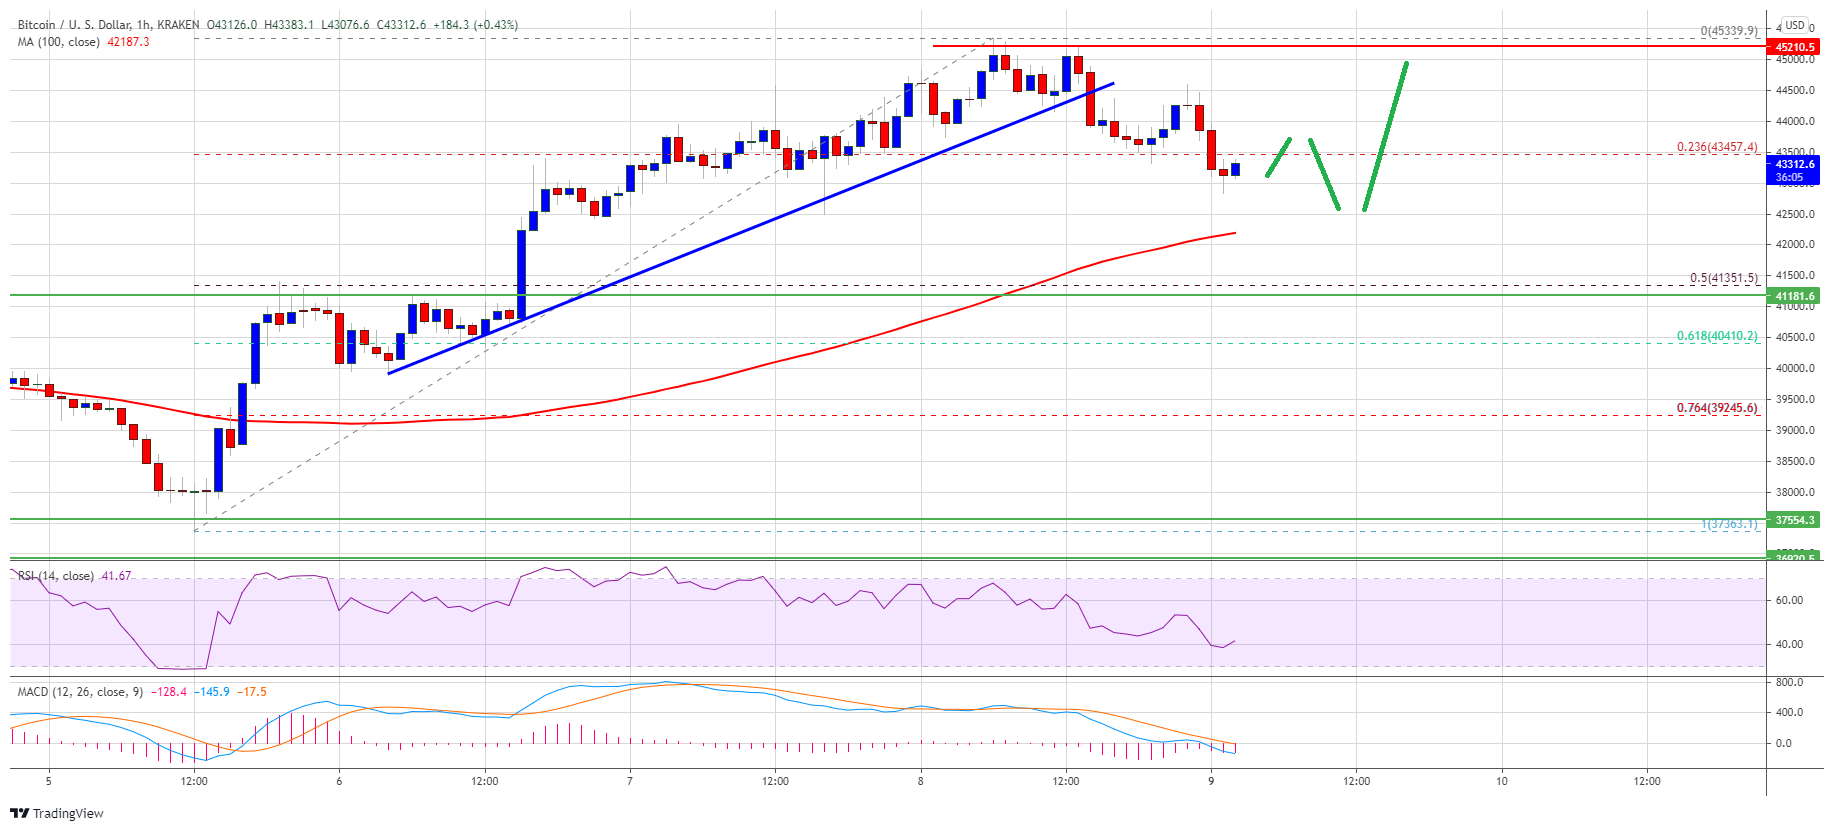
Source: BTCUSD on TradingView.com
Therefore, a close above the $45,000 resistance zone might trigger another increase. The next major resistance is near the $46,500 level. Any more gains could lead the price towards the $48,000 level.
Dips Supported in BTC?
If bitcoin fails to climb above the $44,000 and $45,000 resistance levels, it could start a fresh downside correction. An initial support on the downside is near the $43,000 level.
The first major support is now near the $42,000 zone and the 100 hourly SMA. The main support is near the $41,200 level. It is near the 50% Fib retracement level of the recent rally from the $37,365 swing low to $45,339 high.
Technical indicators:
Hourly MACD – The MACD is slowly losing pace in the bullish zone.
Hourly RSI (Relative Strength Index) – The RSI for BTC/USD is now below the 50 level.
Major Support Levels – $42,000, followed by $41,200.
Major Resistance Levels – $44,000, $44,500 and $45,000.