
Reason to trust
How Our News is Made
Strict editorial policy that focuses on accuracy, relevance, and impartiality
Ad discliamer
Morbi pretium leo et nisl aliquam mollis. Quisque arcu lorem, ultricies quis pellentesque nec, ullamcorper eu odio.
Bitcoin price extended its upward move towards $49,700 before correcting lower against the US Dollar. BTC dipped more than $2,000, but it is likely to remain stable above $45,000.
- Bitcoin started a sharp downside correction after setting a new all-time high near $49,700.
- The price is trading above the $46,000 support, but it is below the 100 hourly simple moving average.
- There is a key bullish trend line forming with support near $46,000 on the hourly chart of the BTC/USD pair (data feed from Kraken).
- The pair is likely to bounce back as long as it is trading above $46,000 and $45,000.
Bitcoin Price is Correcting Gains
There was an upside extension in bitcoin price above the $49,200 level. BTC even traded to a new all-time high near $49,700 before it faced a strong selling interest.
The price declined sharply below the $48,000 and $47,000 levels. Bitcoin traded below a major contracting triangle with support near $47,600 on the hourly chart. There was also a break below the $46,800 support level and the 100 hourly simple moving average.
The price spiked below the last swing low at $46,326. However, it remained stable above the 1.236 Fib extension level of the upward move from the $46,326 low to $49,708 high.
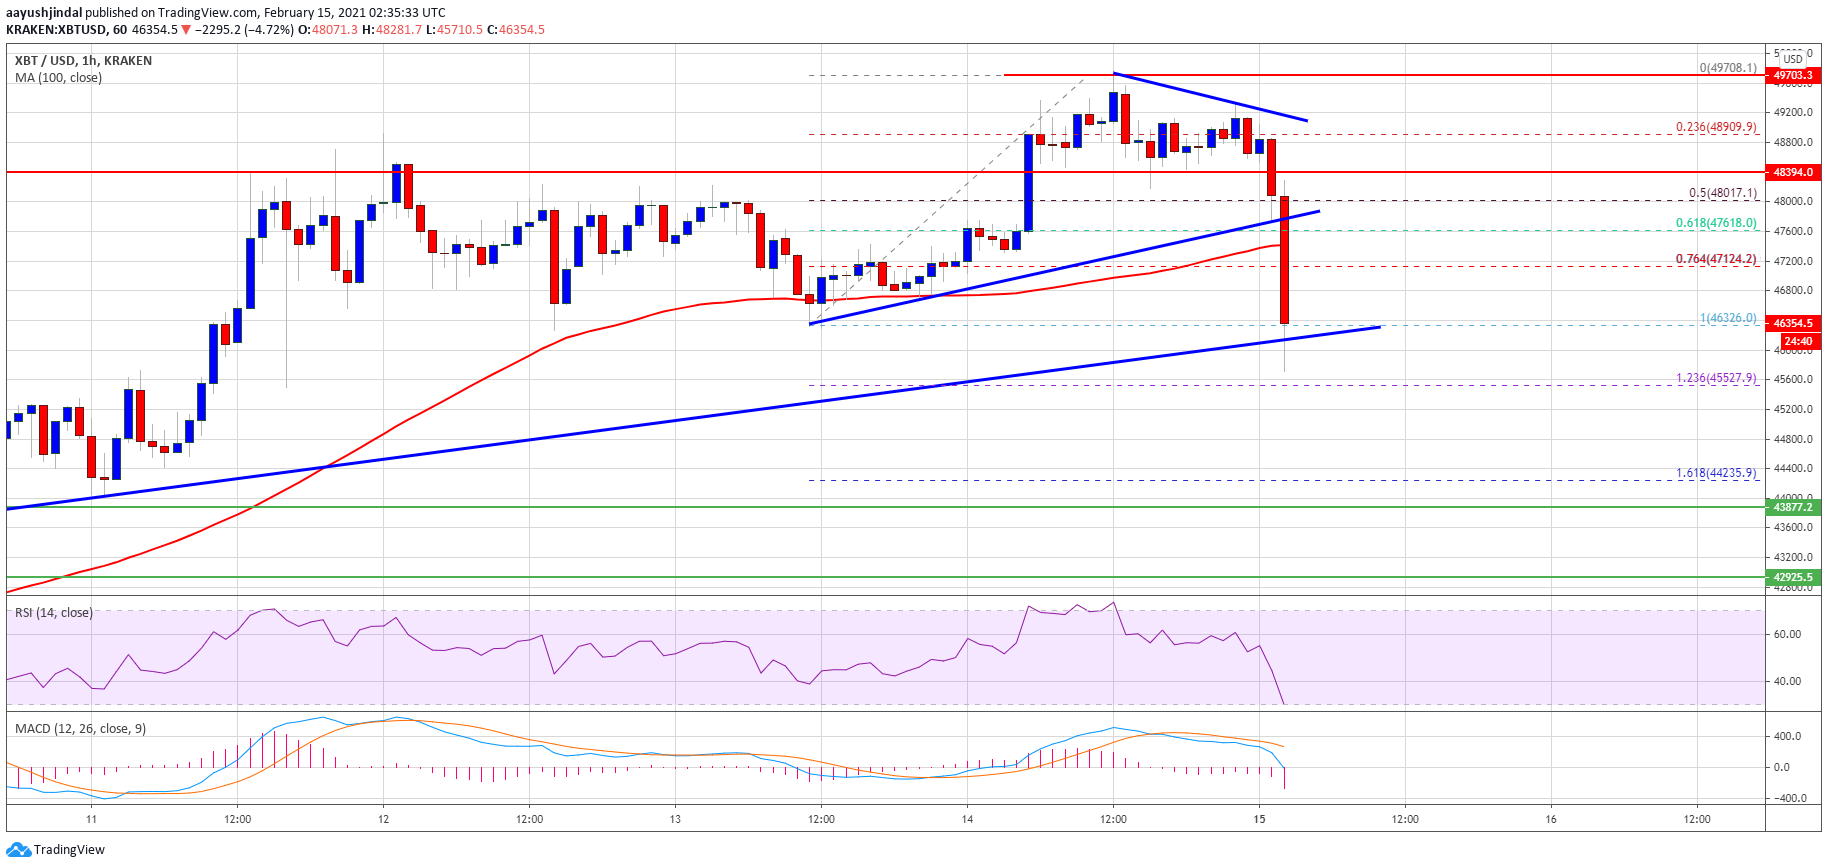
Source: BTCUSD on TradingView.com
There is also a key bullish trend line forming with support near $46,000 on the hourly chart of the BTC/USD pair. If there is a downside break below the trend line support, the price could decline towards the $45,000 support. The next major support is near the $44,250 level. It is close to the 1.618 Fib extension level of the upward move from the $46,326 low to $49,708 high.
Fresh Increase in BTC?
If bitcoin stays above the trend line support, it could start a fresh increase above $46,800. The first key resistance is near the $47,000 level and the 100 hourly simple moving average.
A successful break above the $47,000 resistance level and a close above the 100 hourly SMA might spark a fresh increase. The next key resistance sits near the $48,000 level.
Technical indicators:
Hourly MACD – The MACD is slowly gaining momentum in the bearish zone.
Hourly RSI (Relative Strength Index) – The RSI for BTC/USD is now below the 50 level.
Major Support Levels – $46,000, followed by $45,000.
Major Resistance Levels – $47,000, $47,400 and $48,000.


