
Reason to trust
How Our News is Made
Strict editorial policy that focuses on accuracy, relevance, and impartiality
Ad discliamer
Morbi pretium leo et nisl aliquam mollis. Quisque arcu lorem, ultricies quis pellentesque nec, ullamcorper eu odio.
Bitcoin price is trading in a bullish zone above $57,600 against the US Dollar. BTC is likely to accelerate higher once it clears the $59,800 and $60,000 resistance levels.
- Bitcoin is trading in a positive zone, but it is facing hurdles near $60,000.
- The price is now well above the $58,000 support and the 100 hourly simple moving average.
- There is a major bullish trend line forming with support near $57,800 on the hourly chart of the BTC/USD pair (data feed from Kraken).
- The pair could start a sharp rally if it clears the $59,800 and $60,000 resistance levels.
Bitcoin Price is Showing Positive Signs
Bitcoin mostly traded in a positive zone above the $57,000 pivot level. BTC extended its upward move above the $59,500 resistance level and it settled nicely above the 100 hourly simple moving average.
However, the bulls faced a strong resistance near the $59,800 and $60,000 resistance levels. A high was formed near $59,829 before there was a downside correction. The price declined below the $59,000 and $58,000 levels.
There was also a spike below the $57,500 level, but the bulls protected the 100 hourly simple moving average. A low is formed near the $56,800 level and the price is now back above $58,000. The bulls pushed bitcoin above the 50% Fib retracement level of the downward move from the $59,829 high to $56,800 low.
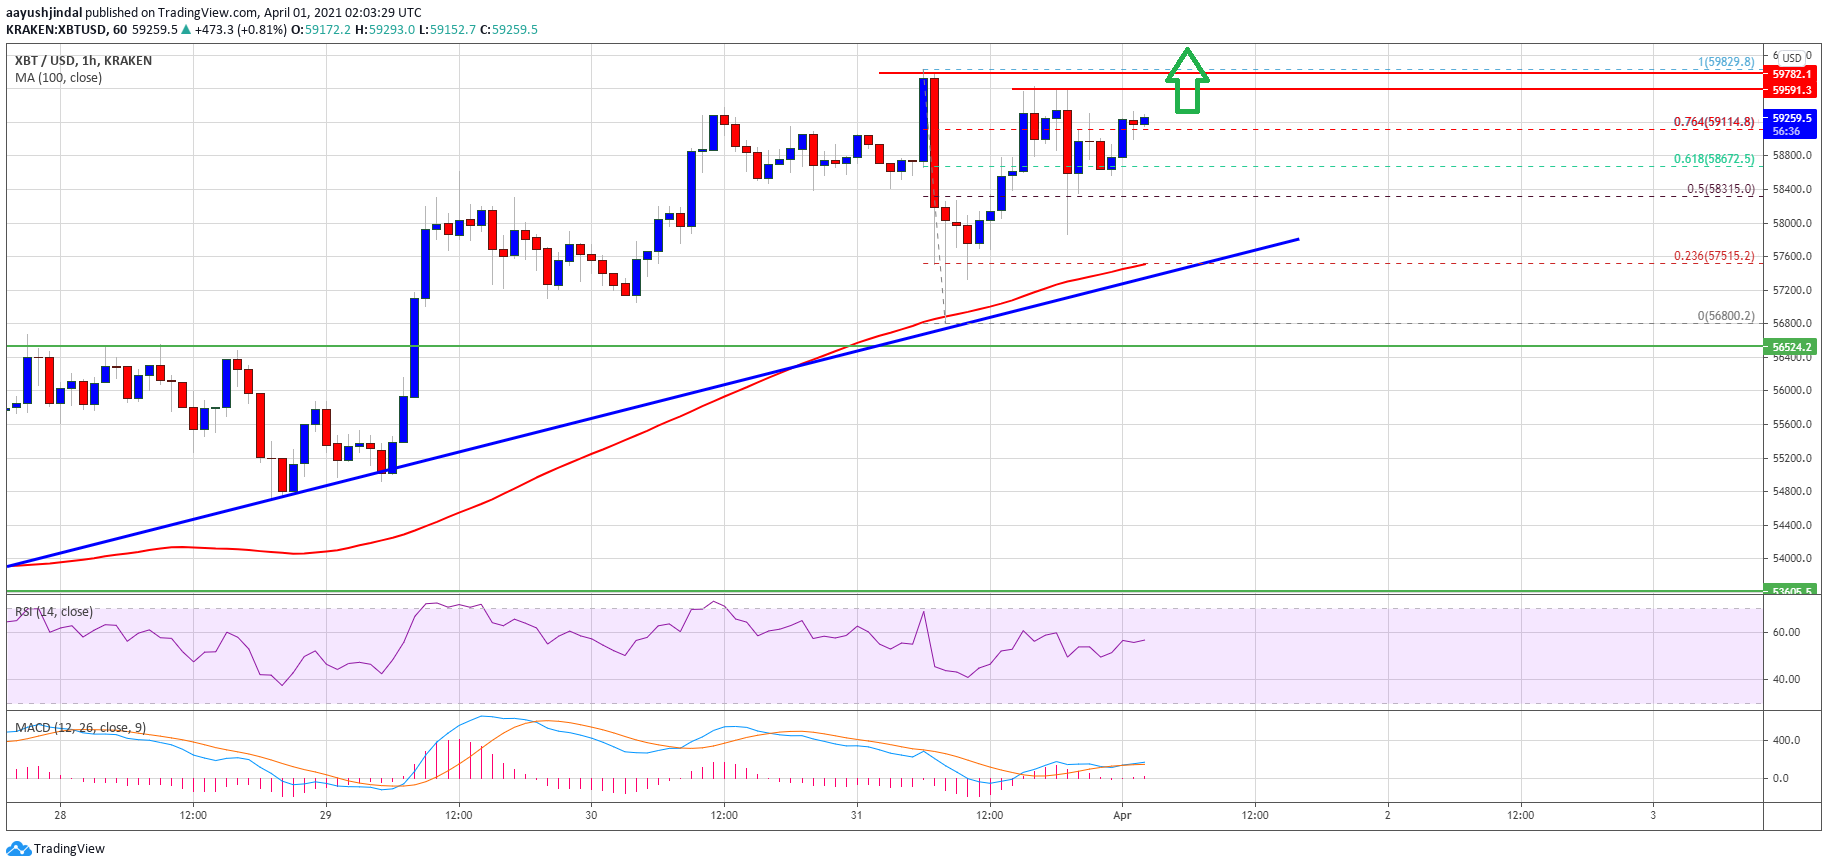
Source: BTCUSD on TradingView.com
It is currently trading well above the $58,000 support and the 100 hourly simple moving average. There is also a major bullish trend line forming with support near $57,800 on the hourly chart of the BTC/USD pair.
Bitcoin seems to be consolidating just above the 76.4% Fib retracement level of the downward move from the $59,829 high to $56,800 low. The key hurdle is near the $59,800 and $60,000 levels. A successful close above the $60,000 level will most likely pump the price towards the $62,000 level in the coming sessions.
Dips Supported in BTC?
If bitcoin fails to climb above $59,800 and $60,000, there could be a downside correction. The first major support on the downside is near the $58,400 level.
The next major support is near the $58,000 level, the 100 hourly SMA, and the trend line. If there is a downside break below the trend line, the price could revisit $56,800.
Technical indicators:
Hourly MACD – The MACD is now gaining momentum in the bullish zone.
Hourly RSI (Relative Strength Index) – The RSI for BTC/USD is well above the 50 level.
Major Support Levels – $58,500, followed by $58,000.
Major Resistance Levels – $59,800, $60,000 and $60,800.