
Reason to trust
How Our News is Made
Strict editorial policy that focuses on accuracy, relevance, and impartiality
Ad discliamer
Morbi pretium leo et nisl aliquam mollis. Quisque arcu lorem, ultricies quis pellentesque nec, ullamcorper eu odio.
Bitcoin price started a downside correction after it broke $39,000 against the US Dollar. BTC tested the key $35,000 support and it is currently consolidating losses.
- Bitcoin started a downside correction below the $39,000 and $38,000 support levels.
- The price is now trading well below $38,000 and the 100 hourly simple moving average.
- There was a break below a key contracting triangle with support near $40,000 on the hourly chart of the BTC/USD pair (data feed from Kraken).
- The pair is holding a major support near $35,000, below which it could dive another $2,000.
Bitcoin Price Corrects Lower
After forming a short-term top near the $42,000 level, bitcoin price started a downside correction. BTC broke a couple of important supports near the $40,000 level to start the current correction.
There was also a break below a key contracting triangle with support near $40,000 on the hourly chart of the BTC/USD pair. The pair settled well below the $38,000 level and the 100 hourly simple moving average.
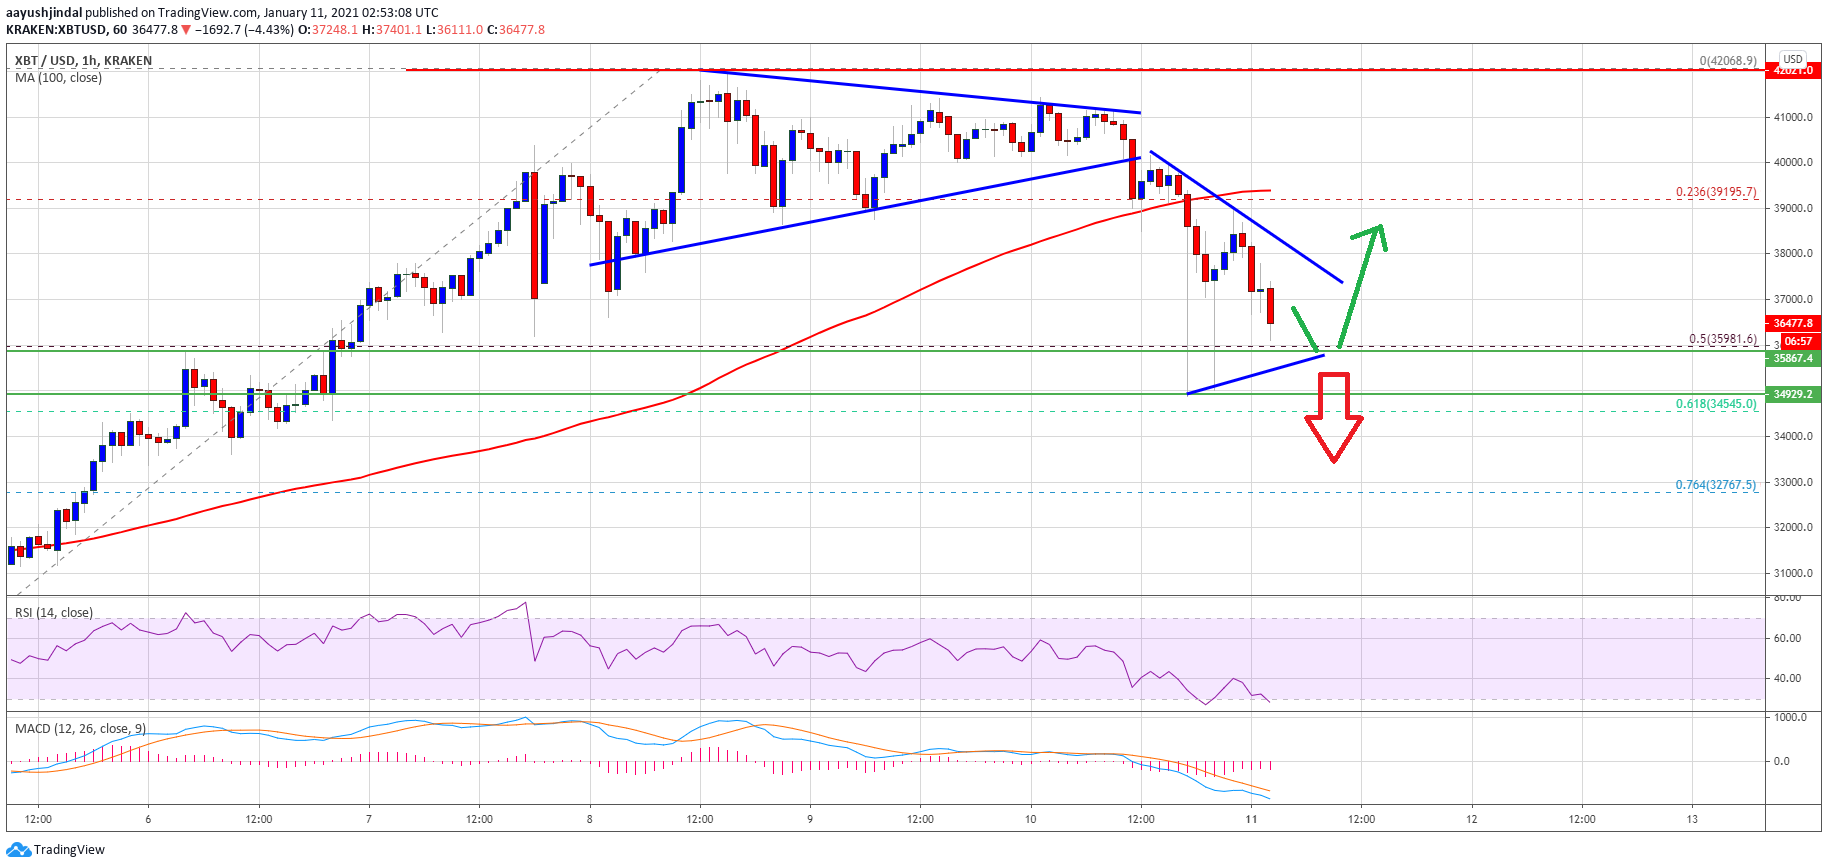
Source: BTCUSD on TradingView.com
There was also a spike below the 50% Fib retracement level of the upward move from the $29,894 swing low to $42,068 swing high. However, the bulls were seen active near the $35,000 support zone (the last key breakout zone).
The next major support is near the $34,500 level. It is close to the 61.8% Fib retracement level of the upward move from the $29,894 swing low to $42,068 swing high. If bitcoin fails to stay above the $35,000 and $34,500 support levels, it could start another decline. The next major support below $34,500 is near the $32,000 level.
Fresh Increase in BTC?
If bitcoin stays above the $34,500 and $35,000 support levels, it could start a fresh increase. An initial resistance on the upside is near the $37,800 level. There is also a contracting triangle forming with resistance near $38,000.
A clear break above the $37,800 and $38,000 resistance levels may possibly spark a bullish wave. The next key resistance is near the $39,200 level and the 100 hourly simple moving average (the recent breakdown zone). A close above $39,200 might increase the chances of a fresh wave towards the $42,000 level.
Technical indicators:
Hourly MACD – The MACD is gaining momentum in the bearish zone.
Hourly RSI (Relative Strength Index) – The RSI for BTC/USD dipped below the 40 level.
Major Support Levels – $35,000, followed by $34,500.
Major Resistance Levels – $37,800, $38,000 and $39,200.