
Reason to trust
How Our News is Made
Strict editorial policy that focuses on accuracy, relevance, and impartiality
Ad discliamer
Morbi pretium leo et nisl aliquam mollis. Quisque arcu lorem, ultricies quis pellentesque nec, ullamcorper eu odio.
Bitcoin price started a downside correction below $46,000 against the US Dollar. BTC is now consolidating above the $43,800 support and the 100 hourly SMA.
- Bitcoin failed to stay above the $47,000 level and corrected below $46,000.
- The price is holding the $44,000 level and the 100 hourly simple moving average.
- There was a break below a key contracting triangle pattern with support near $46,000 on the hourly chart of the BTC/USD pair (data feed from Kraken).
- The pair is likely to start a fresh increase if it stays above $43,000 and the 100 hourly SMA.
Bitcoin Price is Showing a Few Bearish Signs
After struggling to climb back above $47,000, bitcoin price started a downside correction. BTC traded below the $46,000 support level to move into a short-term bearish zone.
There was also a break below a key contracting triangle pattern with support near $46,000 on the hourly chart of the BTC/USD pair. The pair even traded below the $45,000 and $44,450 levels. A low is formed near $43,748 and the price is currently consolidating losses.
An initial resistance on the upside is near the $45,500 level. It is close to the 50% Fib retracement level recent decline from the $47,356 high to $43,748 low.
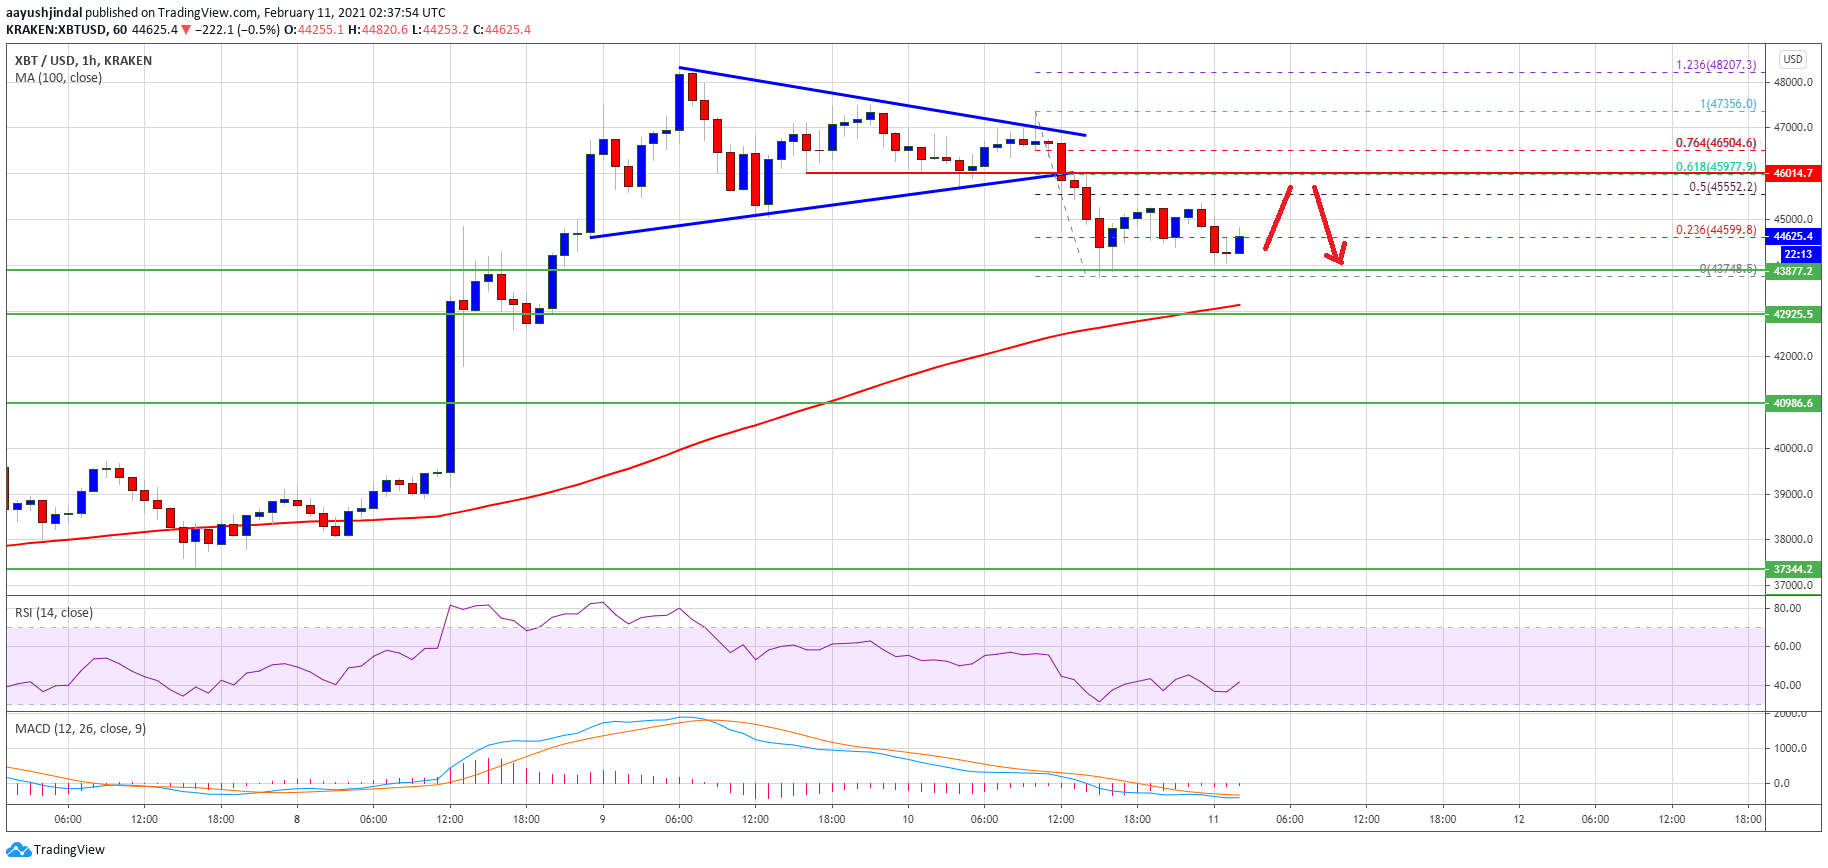
The next major resistance is near the $46,000 level (the recent breakdown zone). The 61.8% Fib retracement level recent decline from the $47,356 high to $43,748 low is also near the $46,000 level. A successful break above the $46,000 resistance level is likely to start a fresh increase in the near term.
The next major resistance is near the $47,000 level. Any more gains could open the doors for a push towards the $48,000 level.
Dips Supported in BTC?
If bitcoin fails to continue higher, it could correct further lower below the $44,000 level. The first major support is near the $43,750 level.
The main support is now forming near the $43,000 level or the 100 hourly simple moving average. Any more losses below the $43,000 may possibly lead the price towards the $41,000 support level in the near term.
Technical indicators:
Hourly MACD – The MACD is slowly losing momentum in the bearish zone.
Hourly RSI (Relative Strength Index) – The RSI for BTC/USD is now below the 50 level.
Major Support Levels – $43,750, followed by $43,000.
Major Resistance Levels – $45,500, $46,000 and $47,000.