
Reason to trust
How Our News is Made
Strict editorial policy that focuses on accuracy, relevance, and impartiality
Ad discliamer
Morbi pretium leo et nisl aliquam mollis. Quisque arcu lorem, ultricies quis pellentesque nec, ullamcorper eu odio.
Bitcoin price surged above the $40,000 level before correcting lower against the US Dollar. BTC traded below $38,000, but it is likely to find a strong support near $36,500 or $35,200
- Bitcoin extended its rally above the $38,000 and $40,000 resistance levels.
- The price started a downside correction from a new all-time high at $40,400, but it is still well above the 100 hourly simple moving average.
- There was a break below a key bullish trend line with support near $37,500 on the hourly chart of the BTC/USD pair (data feed from Kraken).
- The pair is likely to find a strong buying interest near the $36,500 and $35,200 levels.
Bitcoin Price Rallies To $40K
There was a strong upward move in bitcoin price above the $37,000 resistance level. BTC even broke the $38,000 and $38,500 resistance levels. Finally, there was a spike above the $40,000 level.
The price traded to a new all-time high at $40,400 and settled well above the 100 hourly simple moving average. It started a downside correction and traded below the $38,000 level. There was a break below the 23.6% Fib retracement level of the upward move from the $30,000 swing low to $40,365 swing high.
There was also a break below a key bullish trend line with support near $37,500 on the hourly chart of the BTC/USD pair. The pair is currently consolidating near the $37,000 level.
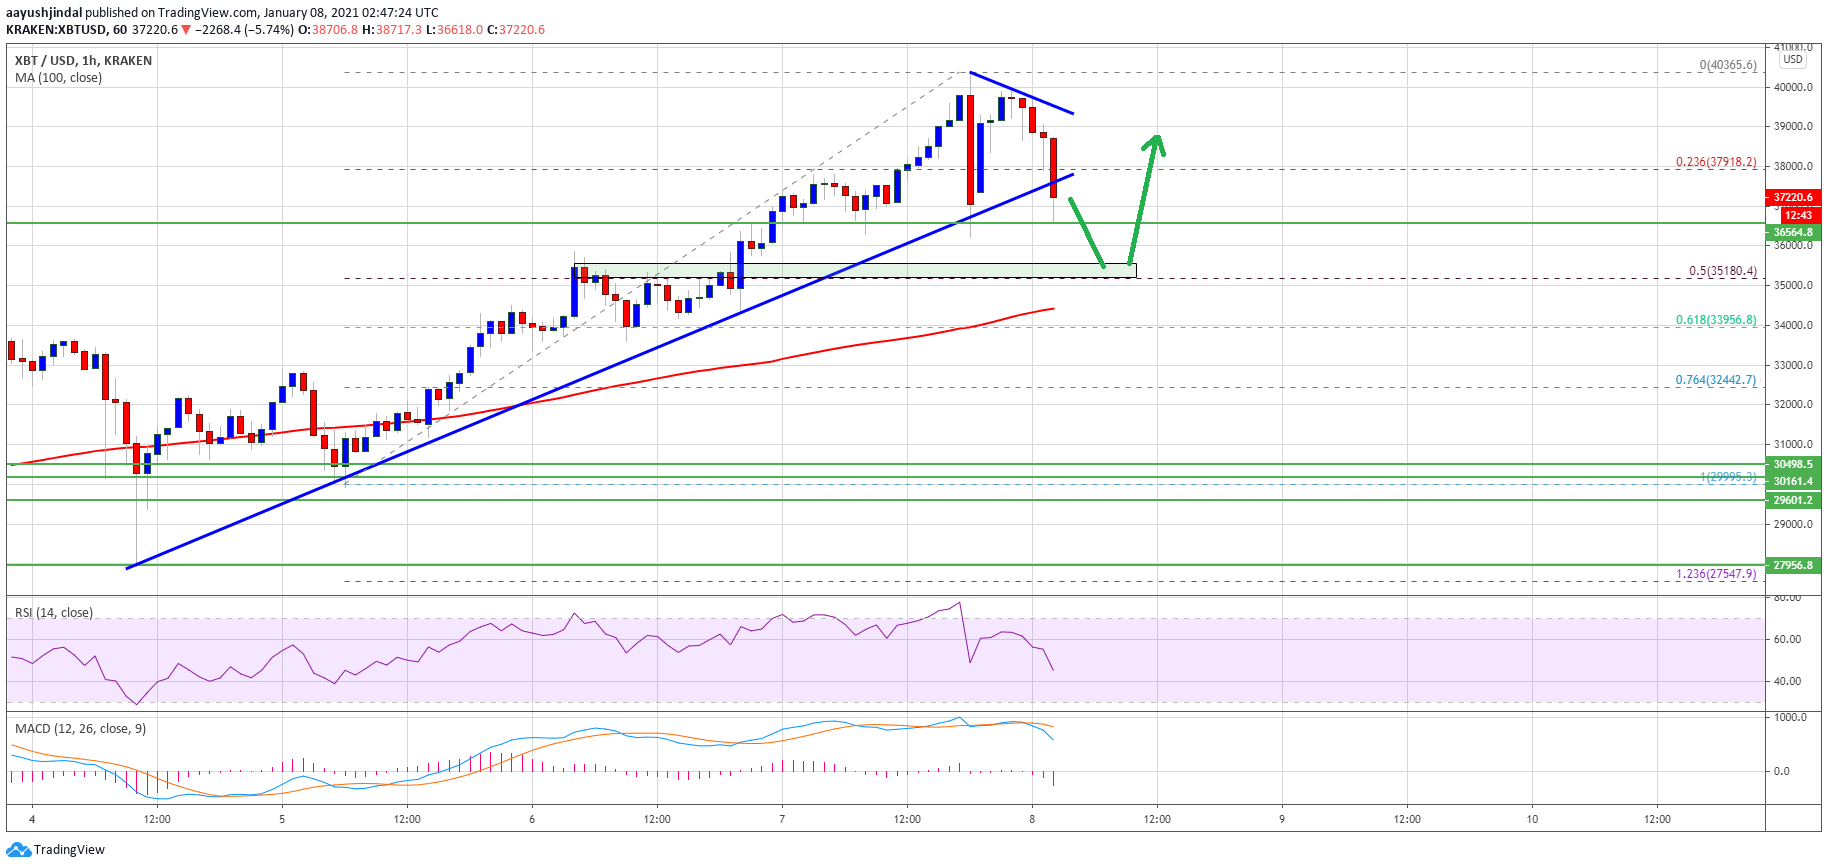
Source: BTCUSD on TradingView.com
The next major support is near the $36,500 level (a multi-touch zone). On the upside, the broken trend line might act as a short-term resistance near $37,500 and $37,800. To start a fresh increase, the price must settle above the $38,000 level. The next key resistance is near $38,880, above which the price could revisit the $40,000 level.
Dips Supported in BTC?
If bitcoin fails to clear the $38,000 and $38,880 levels, it could start another downward move. An initial support on the downside is near the $36,600 and $36,500 levels.
The main support seems to be forming near the $35,200 level. It is close to the 50% Fib retracement level of the upward move from the $30,000 swing low to $40,365 swing high.
Technical indicators:
Hourly MACD – The MACD is gaining momentum in the bearish zone.
Hourly RSI (Relative Strength Index) – The RSI for BTC/USD just dipped below the 50 level.
Major Support Levels – $36,500, followed by $35,200.
Major Resistance Levels – $38,000, $38,880 and $39,800.