
Reason to trust
How Our News is Made
Strict editorial policy that focuses on accuracy, relevance, and impartiality
Ad discliamer
Morbi pretium leo et nisl aliquam mollis. Quisque arcu lorem, ultricies quis pellentesque nec, ullamcorper eu odio.
Bitcoin price is struggling to settle above $15,500 and $15,600 against the US Dollar. BTC is likely to start a sharp downside correction if it breaks the $15,000 support.
- Bitcoin is showing a few bearish signs below the $15,500 and $15,600 levels.
- The price is currently trading below $15,400 and the 100 hourly simple moving average.
- There is a key connecting bullish trend line forming with support near $15,050 on the hourly chart of the BTC/USD pair (data feed from Kraken).
- The pair could start a sharp downside correction if it continues to face resistance near $15,500.
Bitcoin Price is Facing Hurdles
There was an increase in selling pressure on bitcoin price from the $15,850 zone. BTC declined over $500 and it even spiked below the $15,000 support. A low was formed near $14,815 before the price started a fresh increase.
There was a break above the $15,100 level, plus the price traded above the 23.6% Fib retracement level of the recent decline from the $15,850 high to $14,815 swing low. However, the price seems to be facing a strong resistance near the $15,450 and $15,500 levels.
The 50% Fib retracement level of the recent decline from the $15,850 high to $14,815 swing low is also acting as a hurdle for the bulls. It is currently trading below $15,400 and the 100 hourly simple moving average.
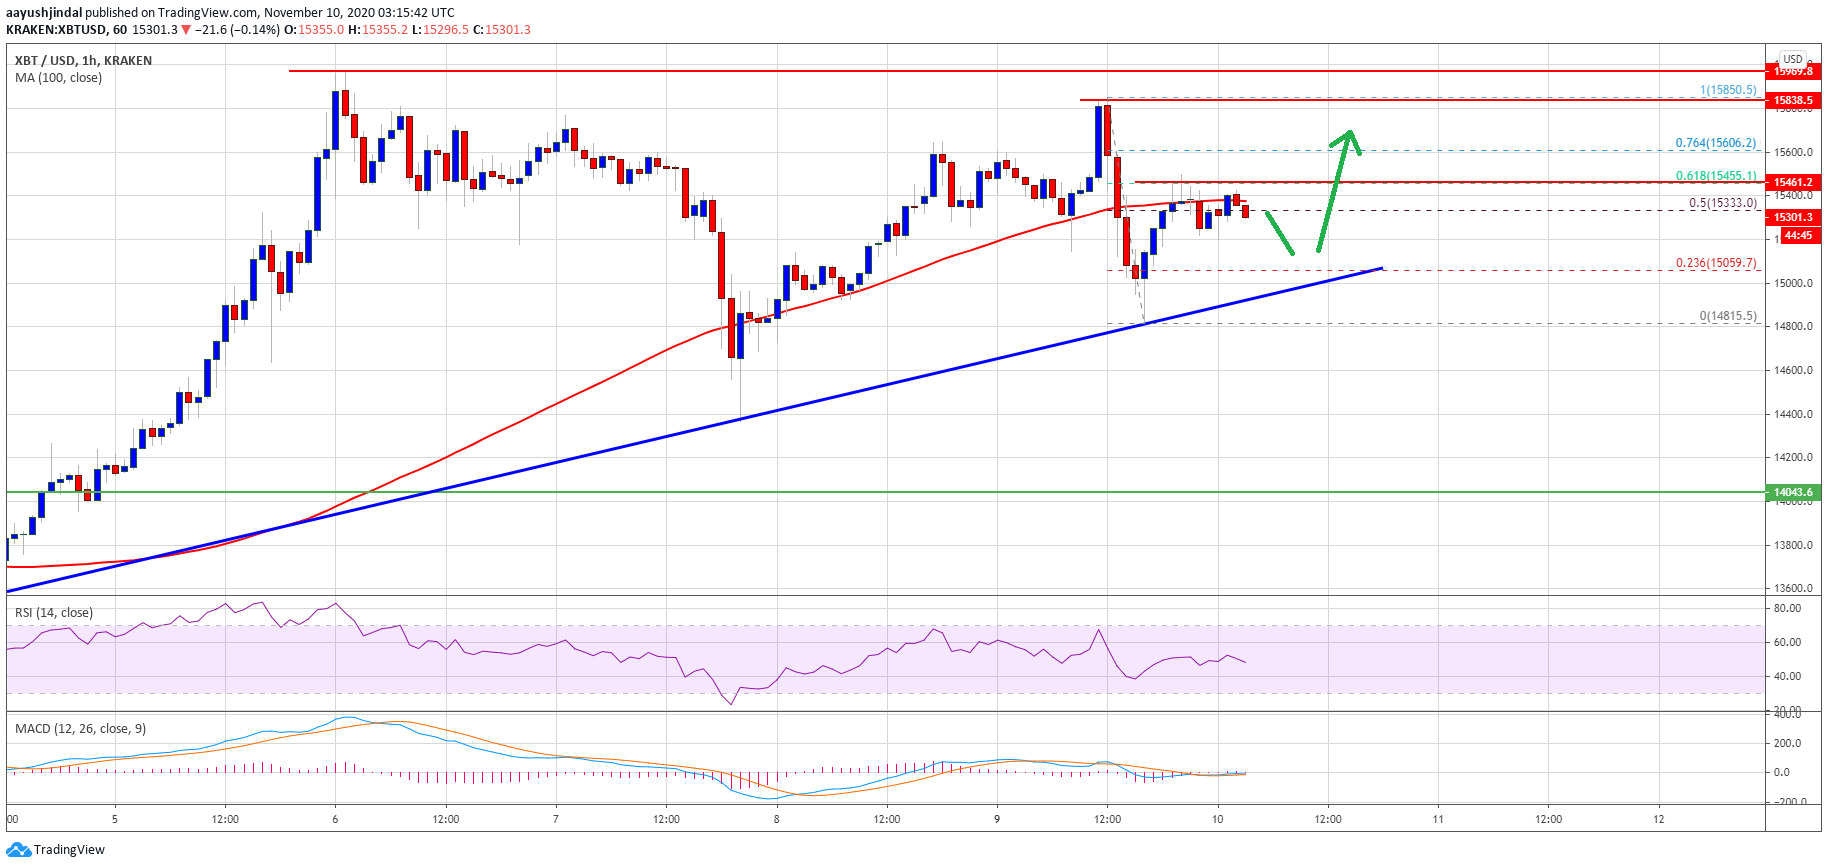
Source: BTCUSD on TradingView.com
To move into a positive zone, bitcoin price must break $15,450 and then gain traction above $15,500. The next resistance is near the $15,600 level, above which there are real chances of a sustained upward move towards the $15,850 and $16,000 levels.
Another Downside Correction in BTC?
If bitcoin fails to clear the $15,500 resistance, there is a risk of a fresh downside correction. An initial support is near the $15,200 level.
There is also a key connecting bullish trend line forming with support near $15,050 on the hourly chart of the BTC/USD pair. If there is a clear break below the trend line support, the price might decline further below $15,000. The next major support is near $14,850, below which the price might revisit $14,500 in the coming sessions.
Technical indicators:
Hourly MACD – The MACD is struggling to gain pace in the bullish zone.
Hourly RSI (Relative Strength Index) – The RSI for BTC/USD is moving lower towards the 40 level.
Major Support Levels – $15,200, followed by $15,000.
Major Resistance Levels – $15,450, $15,500 and $15,600.