
Reason to trust
How Our News is Made
Strict editorial policy that focuses on accuracy, relevance, and impartiality
Ad discliamer
Morbi pretium leo et nisl aliquam mollis. Quisque arcu lorem, ultricies quis pellentesque nec, ullamcorper eu odio.
Bitcoin extended its recovery above $51,000 against the US Dollar. BTC must remain stable above $49,500 to continue higher in the near term.
- Bitcoin started a recovery wave above the $50,500 resistance zone.
- The price is now trading above $50,000 and the 100 hourly simple moving average.
- There was a break below a connecting bullish trend line with support near $50,800 on the hourly chart of the BTC/USD pair (data feed from Kraken).
- The pair could start a fresh increase if it is above the $49,500 level.
Bitcoin Price Loses Steam
Bitcoin price extended its recovery wave above the $50,000 resistance zone. BTC even climbed back above the $50,500 and $51,200 resistance levels.
However, the price failed to surpass the $52,000 resistance zone. A high was formed near $51,955 and the price is now correcting gains. There was a break below the $51,000 support zone. The price declined below the 23.6% Fib retracement level of the upward move from the $47,210 swing low to $51,955 high.
There was also a break below a connecting bullish trend line with support near $50,800 on the hourly chart of the BTC/USD pair. The pair is now trading above $50,000 and the 100 hourly simple moving average.
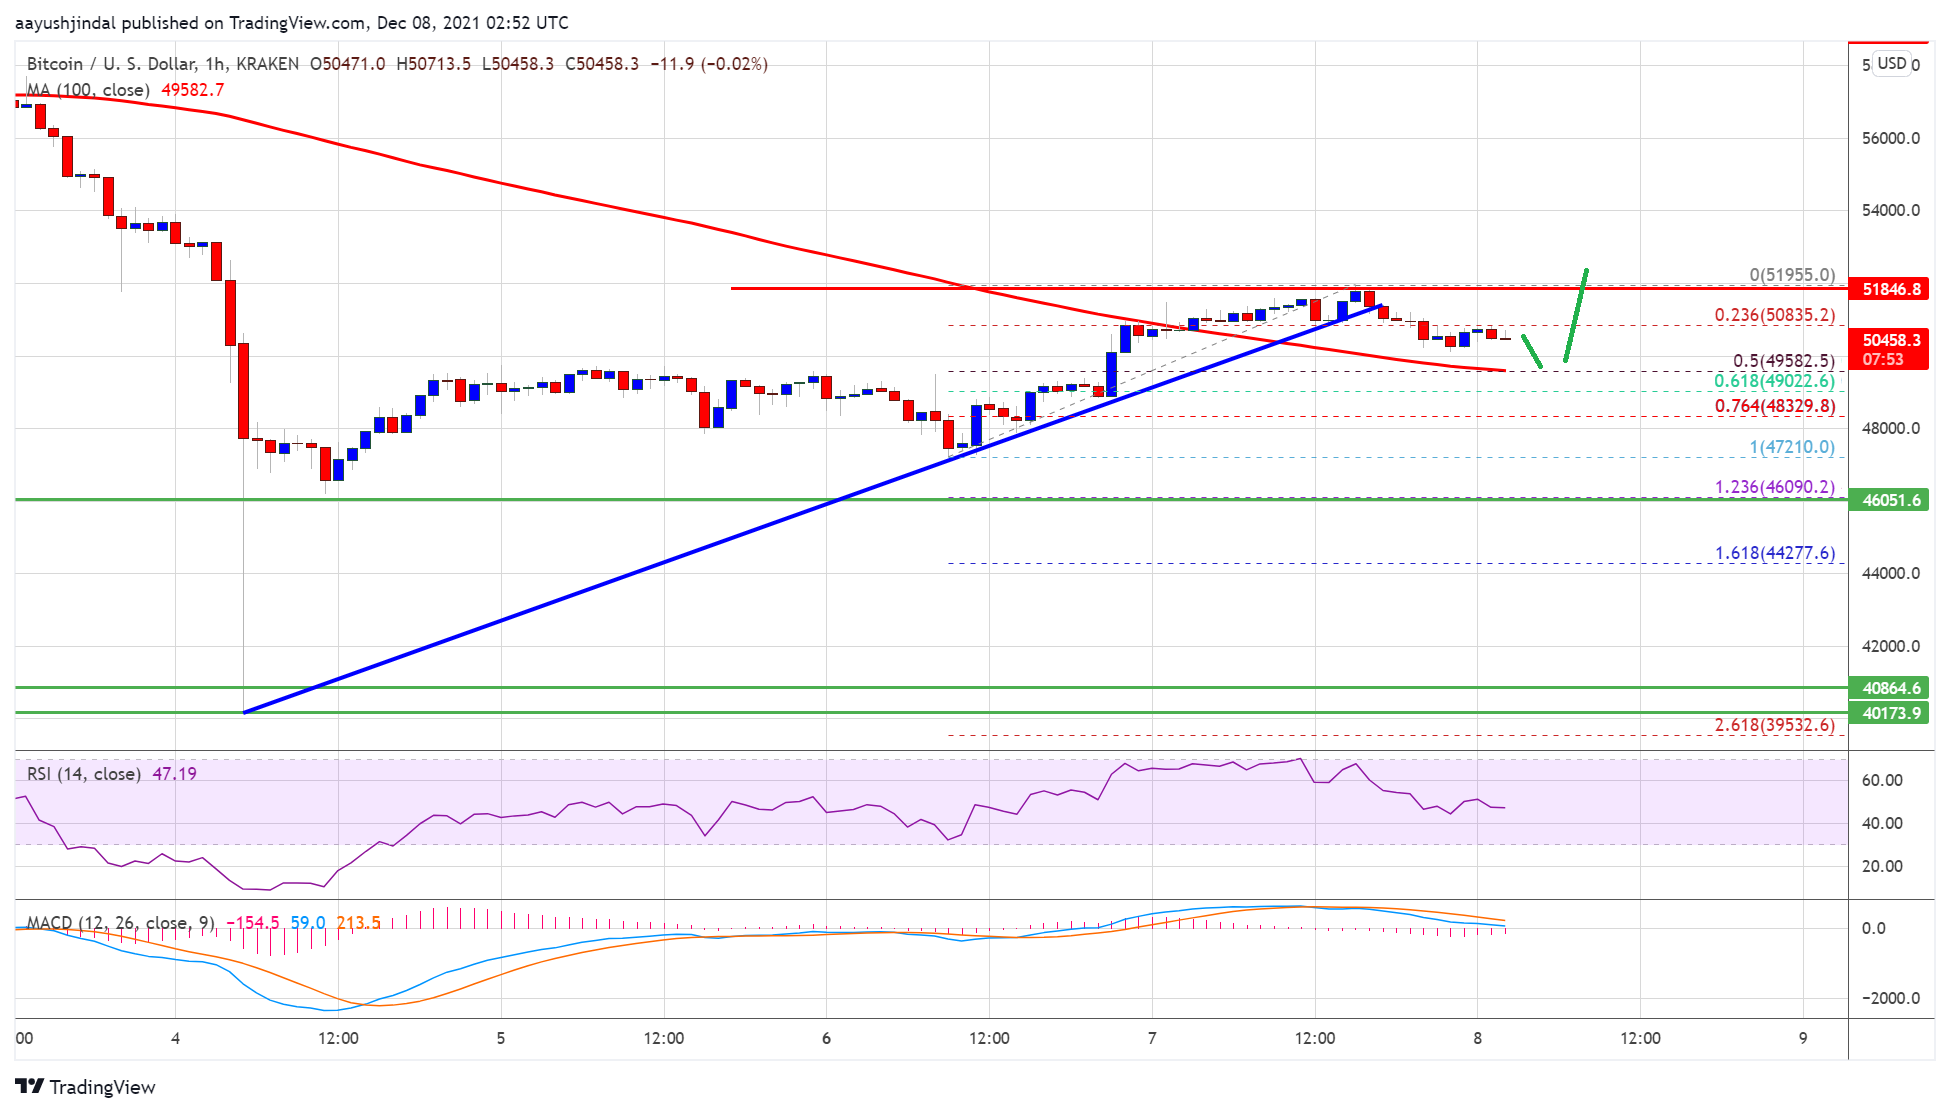
Source: BTCUSD on TradingView.com
An immediate resistance on the upside is near the $51,000 level. The next major resistance is near the $51,800 level. A clear break above the $51,080 resistance zone could open the doors for more upsides. The next key resistance is near the $52,000 level, above which the price could rise further. In the stated case, the price could rise towards the $53,500 level.
More Losses In BTC?
If bitcoin fails to clear the $51,800 resistance zone, it could continue to move down. An immediate support on the downside is near the $50,000 level.
The first major support is now forming near the $49,500 level and the 100 hourly SMA. It is near the 50% Fib retracement level of the upward move from the $47,210 swing low to $51,955 high. A downside break below the $49,500 support may perhaps increase selling pressure. The next stop for the bears might be $48,000.
Technical indicators:
Hourly MACD – The MACD is slowly gaining pace in the bearish zone.
Hourly RSI (Relative Strength Index) – The RSI for BTC/USD is currently below the 50 level.
Major Support Levels – $50,000, followed by $49,500.
Major Resistance Levels – $51,800, $52,000 and $53,500.