
Reason to trust
How Our News is Made
Strict editorial policy that focuses on accuracy, relevance, and impartiality
Ad discliamer
Morbi pretium leo et nisl aliquam mollis. Quisque arcu lorem, ultricies quis pellentesque nec, ullamcorper eu odio.
Bitcoin price started a fresh increase from the $16,200 support zone against the US Dollar. BTC is up 5% and it is trading above $17,500, but facing a major resistance at $18k and $18.2k.
- Bitcoin started a fresh upward move above the $17,000 and $17,200 levels.
- The price is now trading nicely above the $17,500 resistance and the 100 simple moving average (4-hours).
- There was a break above a major contracting triangle with resistance near $17,200 on the 4-hours chart of the BTC/USD pair (data feed from Kraken).
- The pair could revisit the $18,200 resistance, where the bears might put a strong fight.
Bitcoin Price is Rising Steadily
This past week, bitcoin saw a sharp downside correction below $18,000 and $17,200 against the US Dollar. The BTC/USD pair even broke the $16,800 support and the 100 simple moving average (4-hours).
It traded as low as $16,219 before forming a support base. A fresh increase was initiated above the $16,500 and $16,800 resistance levels. Bitcoin price cleared the $17,400 resistance and 100 simple moving average (4-hours) to move into a positive zone.
There was also a break above a major contracting triangle with resistance near $17,200 on the 4-hours chart of the BTC/USD pair. The pair is now testing the 50% Fib retracement level of the downward move from the $19,500 swing high to $16,220 swing low.
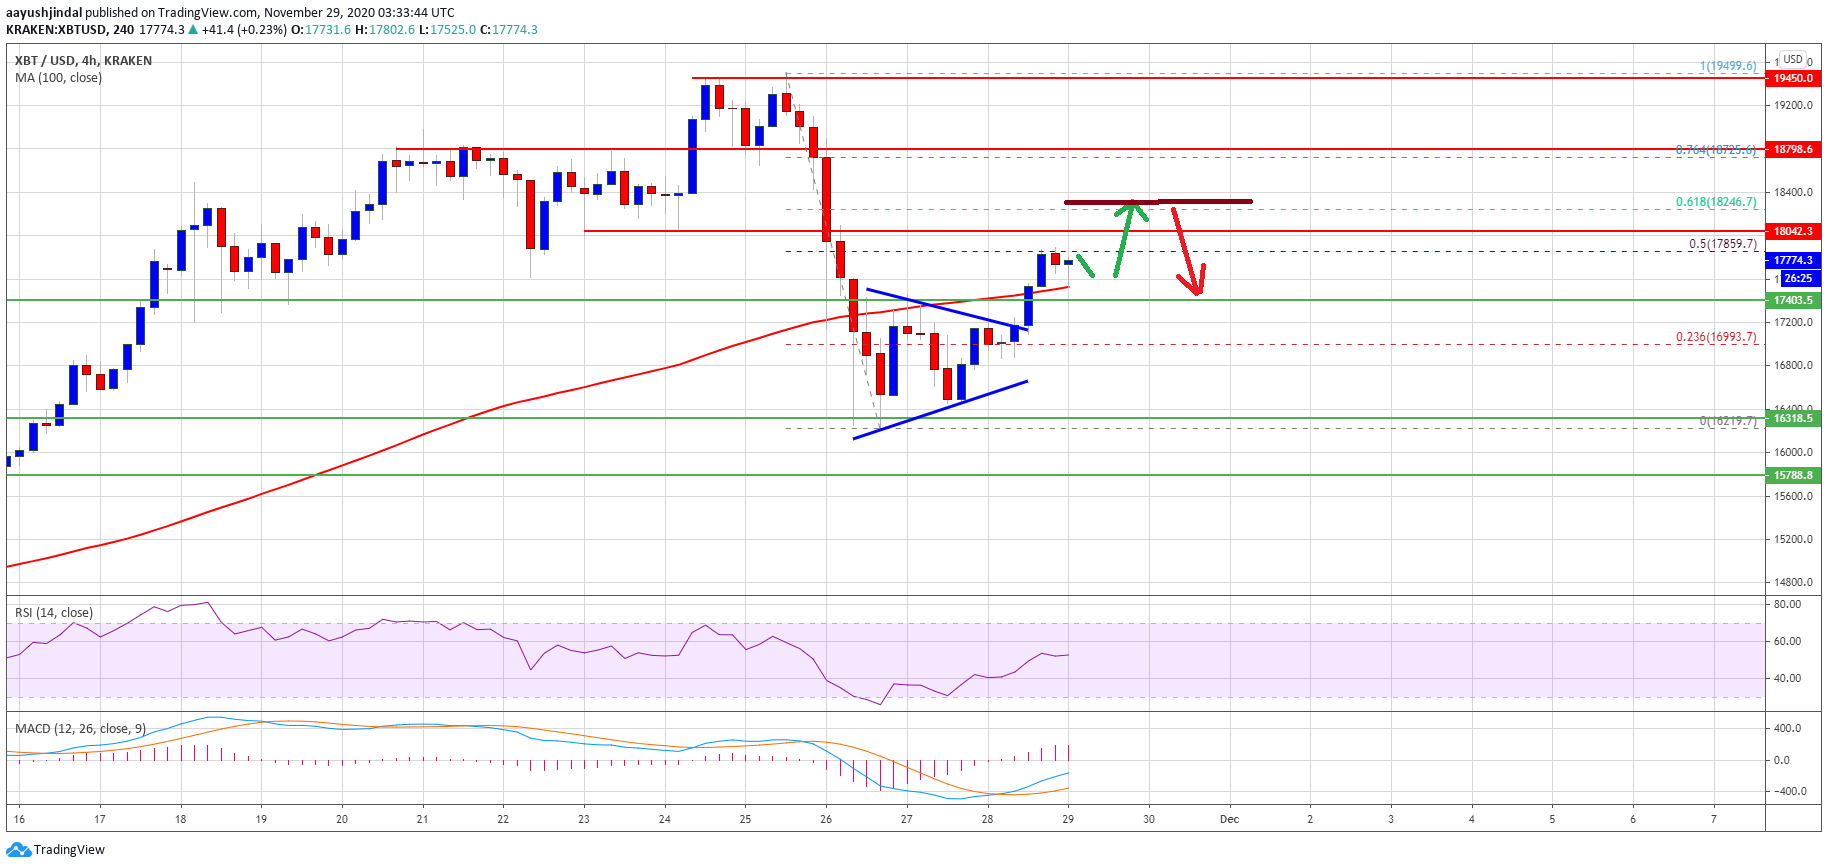
Source: BTCUSD on TradingView.com
A clear break above the $17,850 and $18,000 levels might lead the price towards the key $18,250 resistance zone. It is close to the 61.8% Fib retracement level of the downward move from the $19,500 swing high to $16,220 swing low.
A successful break above the $18,250 and $18,400 levels is needed for a fresh rise towards the $19,000 and $19,500 levels in the coming sessions.
Another Drop in BTC?
If bitcoin fails to clear the $18,000 and $18,250 resistance levels, it could start a fresh decline. An initial support is near the $17,500 level or the 100 simple moving average (4-hours).
The first major support sits at $17,400 levels. A downside break below the $17,400 level could lead the price towards the main $16,800 support level. Any more losses might call for a new low below $16,200.
Technical indicators
4 hours MACD – The MACD for BTC/USD is slowly gaining momentum in the bullish zone.
4 hours RSI (Relative Strength Index) – The RSI for BTC/USD is rising and it is above the 50 level.
Major Support Level – $17,400
Major Resistance Level – $18,250