
Reason to trust
How Our News is Made
Strict editorial policy that focuses on accuracy, relevance, and impartiality
Ad discliamer
Morbi pretium leo et nisl aliquam mollis. Quisque arcu lorem, ultricies quis pellentesque nec, ullamcorper eu odio.
Bitcoin price came under pressure after ripple’s XRP massive decline below $0.3000 against the US Dollar. BTC traded below $23,000, but it is still well above the $22,000 support.
- Bitcoin started a fresh decline after it failed to clear the $24,000 resistance zone.
- The price is currently trading below the $23,000 support and the 100 hourly simple moving average.
- There was a break below a major bullish trend line with support near $23,350 on the hourly chart of the BTC/USD pair (data feed from Kraken).
- The pair is likely to remain well supported on the downside near $22,350 and $22,000.
Bitcoin Price is Slowly Declining
There was another attempt by bitcoin price to clear the $24,000 resistance level. However, BTC struggled to gain momentum and started a fresh decline from the $24,086 swing high.
There was a break below the $23,500 and $23,250 support levels. There was also a break below a major bullish trend line with support near $23,350 on the hourly chart of the BTC/USD pair. The decline gained pace below $23,000 and the price settled below the 100 hourly simple moving average.
It traded as low as $22,629 and it is currently correcting higher. An initial resistance is near the $22,950 level. It is close to the 23.6% Fib retracement level of the recent decline from the $24,081 high to $22,629 low.
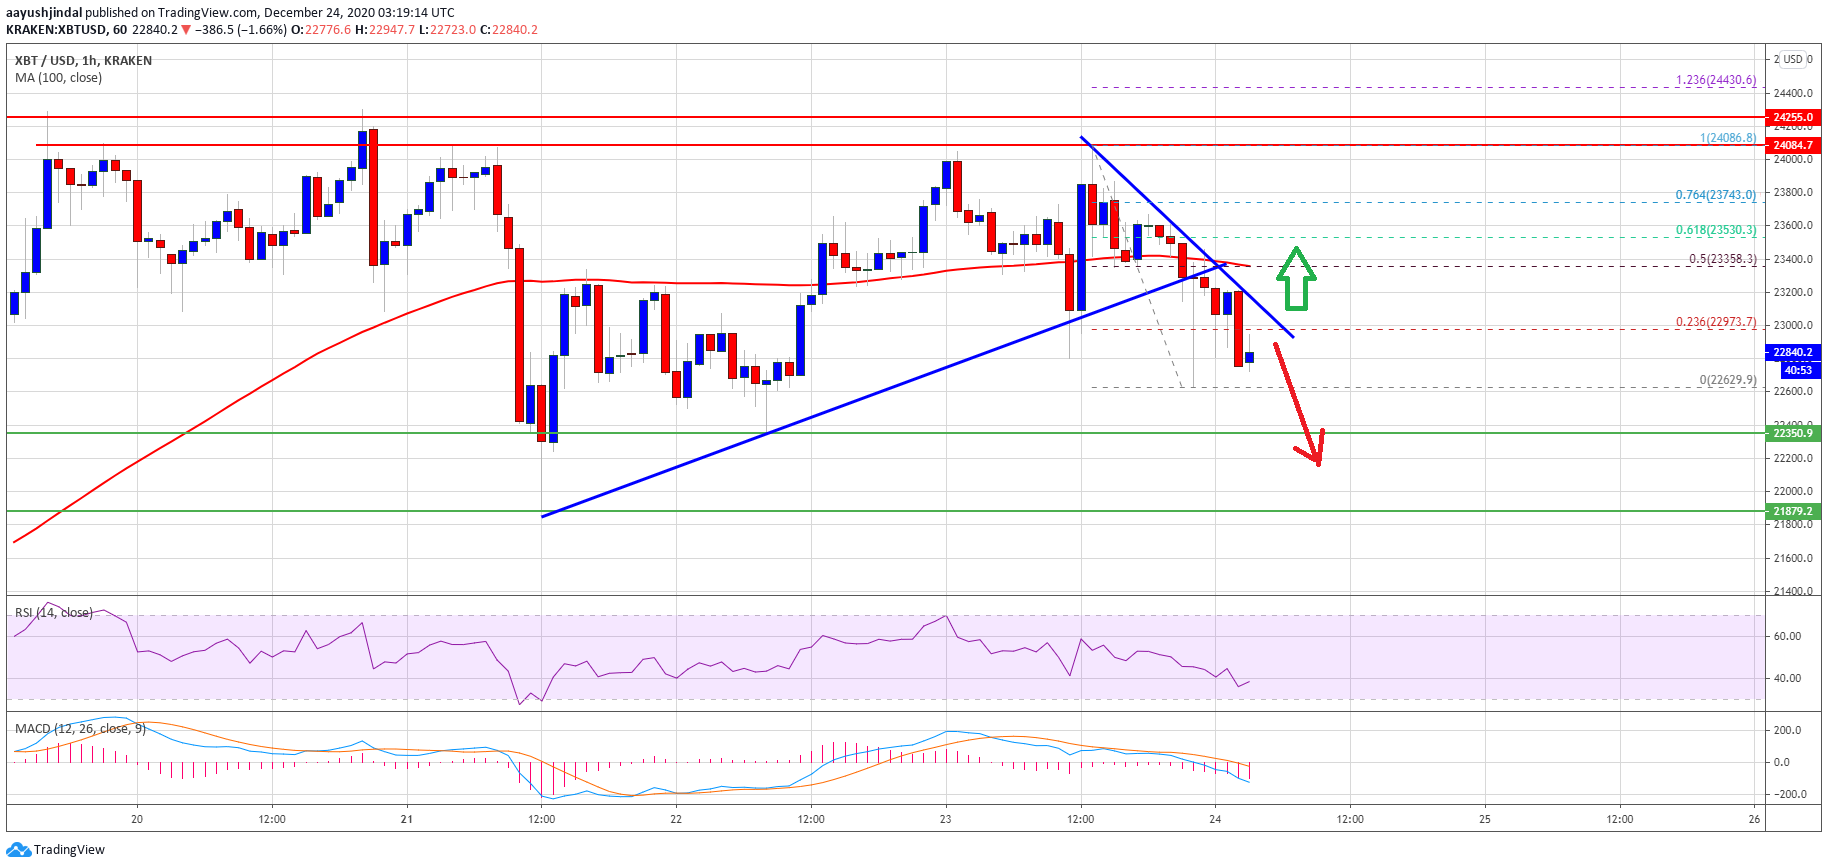
Source: BTCUSD on TradingView.com
There is also a bearish trend line forming with resistance near $23,000 on the same chart. The next major resistance is near the $23,360 level and the 100 hourly simple moving average. The 50% Fib retracement level of the recent decline from the $24,081 high to $22,629 low is also near $23,360.
Bitcoin price must break the trend line and then gain pace above the $23,360 to start a fresh increase. The main hurdle for the bulls is still near the $24,000 zone.
More Losses in BTC?
If bitcoin fails to clear the $23,000 and $23,360 resistance levels, there is a risk of more downsides. An initial support on the downside is near the $22,650 zone.
The first major support is near the $22,350 level. The main support is still near the $22,000 level, below which there is a risk of a sustained downward move in the coming sessions.
Technical indicators:
Hourly MACD – The MACD is gaining momentum in the bearish zone.
Hourly RSI (Relative Strength Index) – The RSI for BTC/USD is currently well below the 50 level.
Major Support Levels – $22,350, followed by $22,000.
Major Resistance Levels – $23,000, $23,360 and $24,000.