
Reason to trust
How Our News is Made
Strict editorial policy that focuses on accuracy, relevance, and impartiality
Ad discliamer
Morbi pretium leo et nisl aliquam mollis. Quisque arcu lorem, ultricies quis pellentesque nec, ullamcorper eu odio.
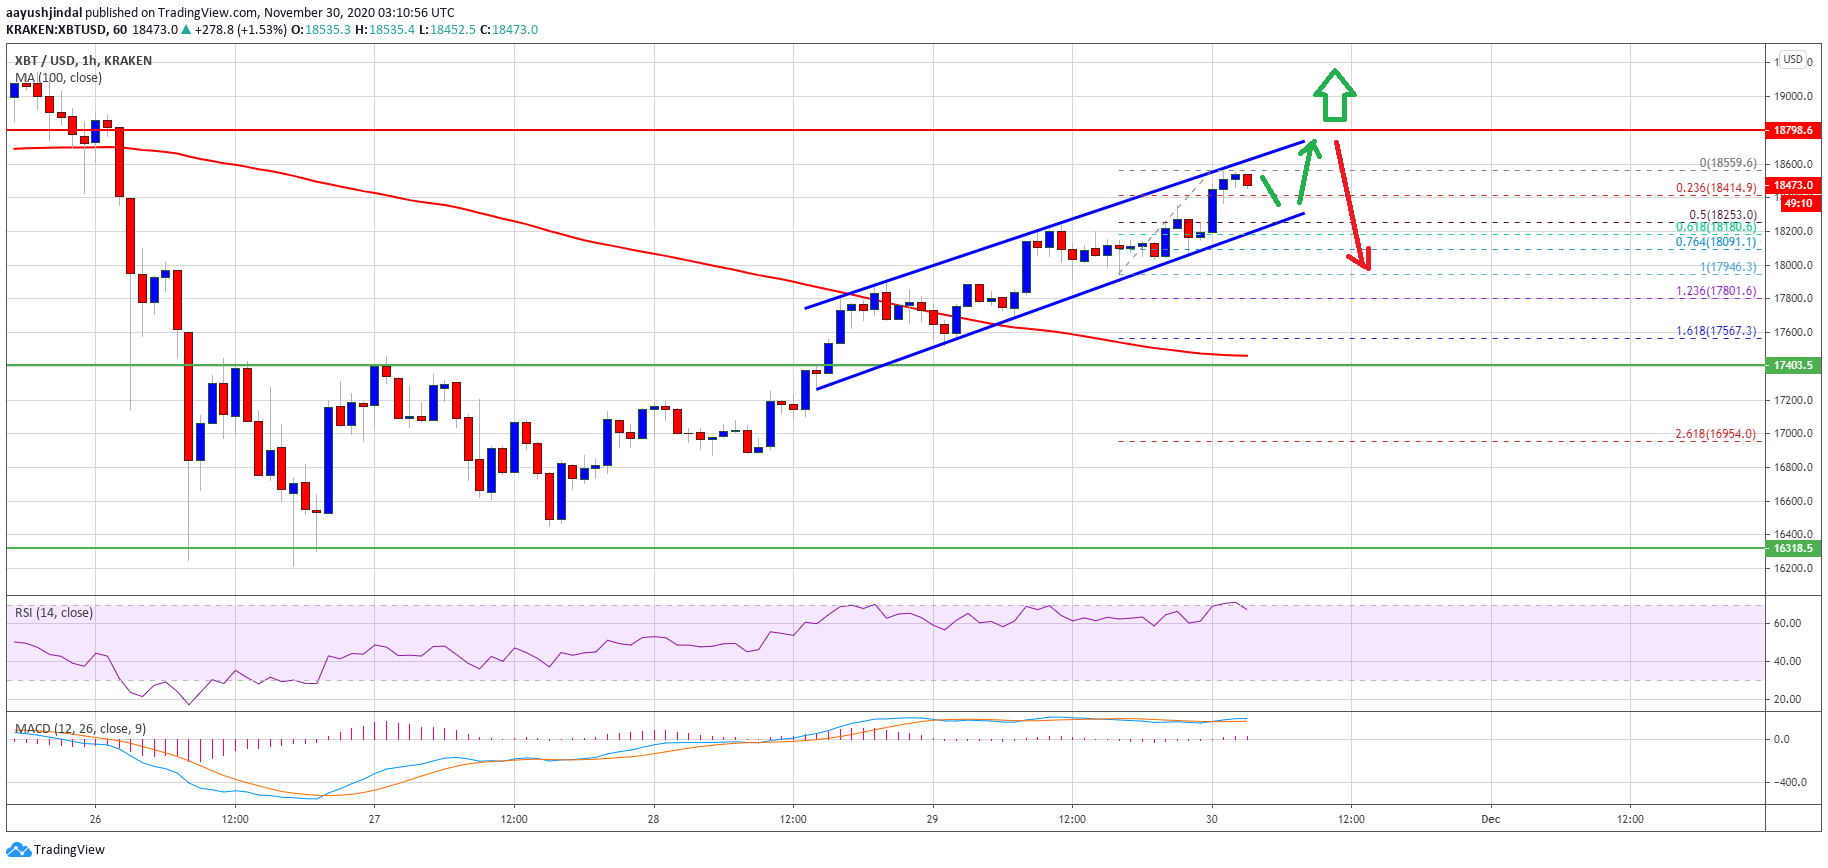
Bitcoin price is up over 4% and it broke the $18,500 level against the US Dollar. BTC is currently following a nice bullish path, but the $18,800 level is a strong resistance.
- Bitcoin is slowly rising and it broke the key $18,500 resistance.
- The price traded as high as $18,559 and it is now above the 100 hourly simple moving average.
- There is a major rising channel forming with support near $18,280 on the hourly chart of the BTC/USD pair (data feed from Kraken).
- The bulls are likely to face a strong resistance near the $18,800 zone.
Bitcoin Price is Approaching a Major Hurdle
In the weekly analysis, we saw a fresh increase in bitcoin price above the $18,000 level. BTC extended its rise above the $18,200 and $18,400 resistance levels.
There was also a break above the $18,500 resistance. The price traded as high as $18,559 and it is now above the 100 hourly simple moving average. It is currently consolidating gains and trading near the $18,450 level.
An initial support on the downside is near the $18,400 level. It is close to the 23.6% Fib retracement level of the recent rise from the $17,946 swing low to $18,559 high. Moreover, there is a major rising channel forming with support near $18,280 on the hourly chart of the BTC/USD pair.
Source: BTCUSD on TradingView.com
The channel support is close to the 50% Fib retracement level of the recent rise from the $17,946 swing low to $18,559 high. On the upside, the channel resistance at $18,650 is a short-term resistance.
The first major resistance for the bulls is near the $18,800 level. A successful break above the $18,800 level could spark a strong upward move, and bitcoin could rise above $19,000 and even $19,200.
Another Drop in BTC?
If bitcoin fails to clear the breakout resistance at $18,800, there is a risk of a fresh decline. An initial support on the downside is near the $18,250 level or the channel lower trend line.
A clear break below the channel support might start an extended decline towards $18,000. The next major support below the $18,000 level is near the $17,400 level and the 100 hourly simple moving average.
Technical indicators:
Hourly MACD – The MACD is now gaining momentum in the bullish zone.
Hourly RSI (Relative Strength Index) – The RSI for BTC/USD is currently well above the 60 level, with bullish signs.
Major Support Levels – $18,250, followed by $18,000.
Major Resistance Levels – $18,650, $18,800 and $19,000.


