
Reason to trust
How Our News is Made
Strict editorial policy that focuses on accuracy, relevance, and impartiality
Ad discliamer
Morbi pretium leo et nisl aliquam mollis. Quisque arcu lorem, ultricies quis pellentesque nec, ullamcorper eu odio.
Bitcoin price rallied above the $27,500 resistance. BTC is consolidating near $28,000 and might start a minor downside correction in the near term.
- Bitcoin gained pace above the $27,200 and $27,500 resistance levels.
- The price is trading above $27,500 and the 100 hourly Simple moving average.
- There is a key bullish trend line forming with support near $27,350 on the hourly chart of the BTC/USD pair (data feed from Kraken).
- The pair is signaling more gains above $28,000 after a mild downside correction.
Bitcoin Price Rallies To $28K
Bitcoin price started a decent increase above the $27,000 resistance zone. BTC gained pace for a move above the $27,200 and $27,500 resistance levels.
The upward move was such that the price even tested the $28,000 resistance. A high is formed near $28,087 and the price is now consolidating gains. It is trading well above the 23.6% Fib retracement level of the upward move from the $26,692 swing low to the $28,087 high.
Bitcoin is trading above $27,500 and the 100 hourly Simple moving average. There is also a key bullish trend line forming with support near $27,350 on the hourly chart of the BTC/USD pair. The trend line is near the 50% Fib retracement level of the upward move from the $26,692 swing low to the $28,087 high.
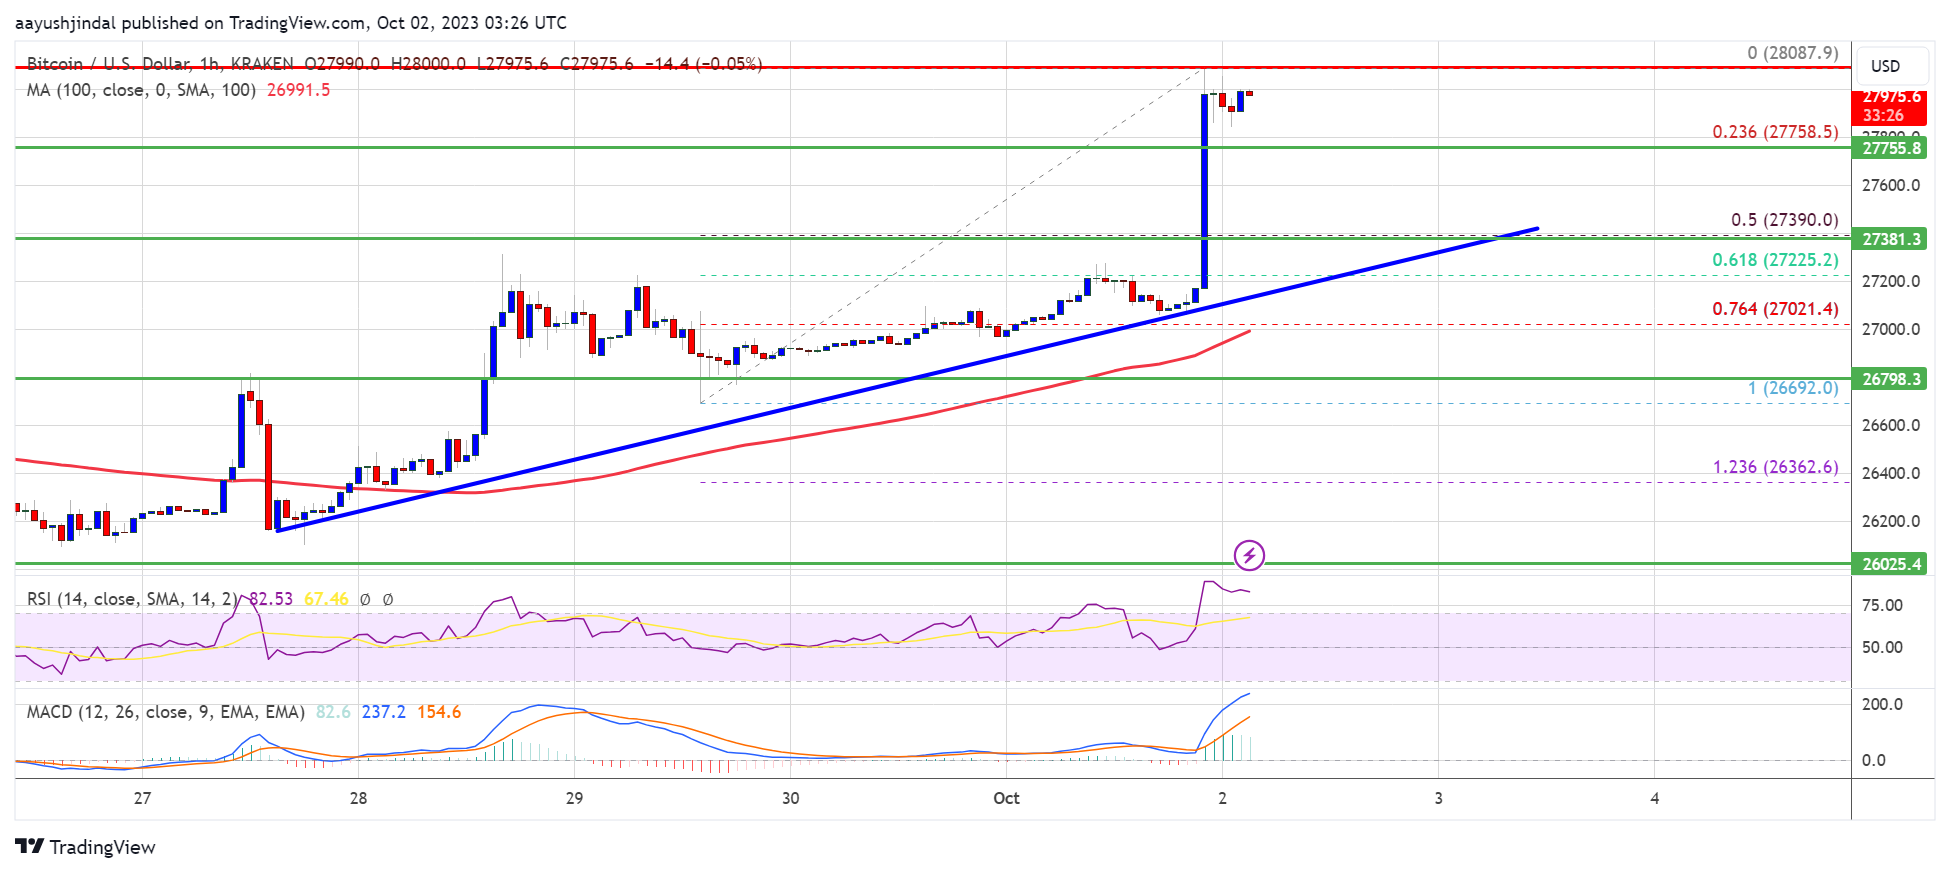
Source: BTCUSD on TradingView.com
Immediate resistance on the upside is near the $28,000 level. The next key resistance could be near the $28,200 level. A close above the $28,200 resistance could send the price further higher. In the stated case, the price could climb toward the $28,800 resistance. Any more gains might call for a move toward the $29,500 level.
Are Dips Supported In BTC?
If Bitcoin fails to continue higher above the $28,000 resistance, there could be a downside correction. Immediate support on the downside is near the $27,750 level.
The next major support is near the $27,350 level or and the trend line. A downside break and close below the $27,350 level might send the price toward $27,000. The next support sits at $26,750. Any more losses might call for a test of $26,200.
Technical indicators:
Hourly MACD – The MACD is now losing pace in the bullish zone.
Hourly RSI (Relative Strength Index) – The RSI for BTC/USD is now above the 50 level.
Major Support Levels – $27,750, followed by $27,350.
Major Resistance Levels – $28,000, $28,200, and $28,800.