
Reason to trust
How Our News is Made
Strict editorial policy that focuses on accuracy, relevance, and impartiality
Ad discliamer
Morbi pretium leo et nisl aliquam mollis. Quisque arcu lorem, ultricies quis pellentesque nec, ullamcorper eu odio.
Bitcoin price recovered nicely after diving towards the $46,000 zone against the US Dollar. BTC is eyeing a fresh increase above $49,000 and it may even test the $50,000 barrier.
- Bitcoin started a fresh increase after correcting lower to $45,700.
- The price is trading above the $47,000 support, but it is below the 100 hourly simple moving average.
- There is a key bearish trend line forming with resistance near $48,500 on the hourly chart of the BTC/USD pair (data feed from Kraken).
- The pair is likely to rally once there is a clear break above the $48,500 and $49,000 resistance levels.
Bitcoin Price is Gaining Momentum
There was a sharp downside correction in bitcoin price from the $49,700 high. BTC dived below the $48,000 and $47,000 support levels. However, the bulls were active above $45,000 and $45,500.
A low was formed near $45,700 and the price recently started a steady increase. There was a break above the $47,000 resistance level. The price was able to climb back above the 50% Fib retracement level of the downward move from the $49,700 swing high to $45,700 low.
It is now trading above the $47,000 support, but it is below the 100 hourly simple moving average. An immediate resistance is near the $48,500 level. There is also a key bearish trend line forming with resistance near $48,500 on the hourly chart of the BTC/USD pair.
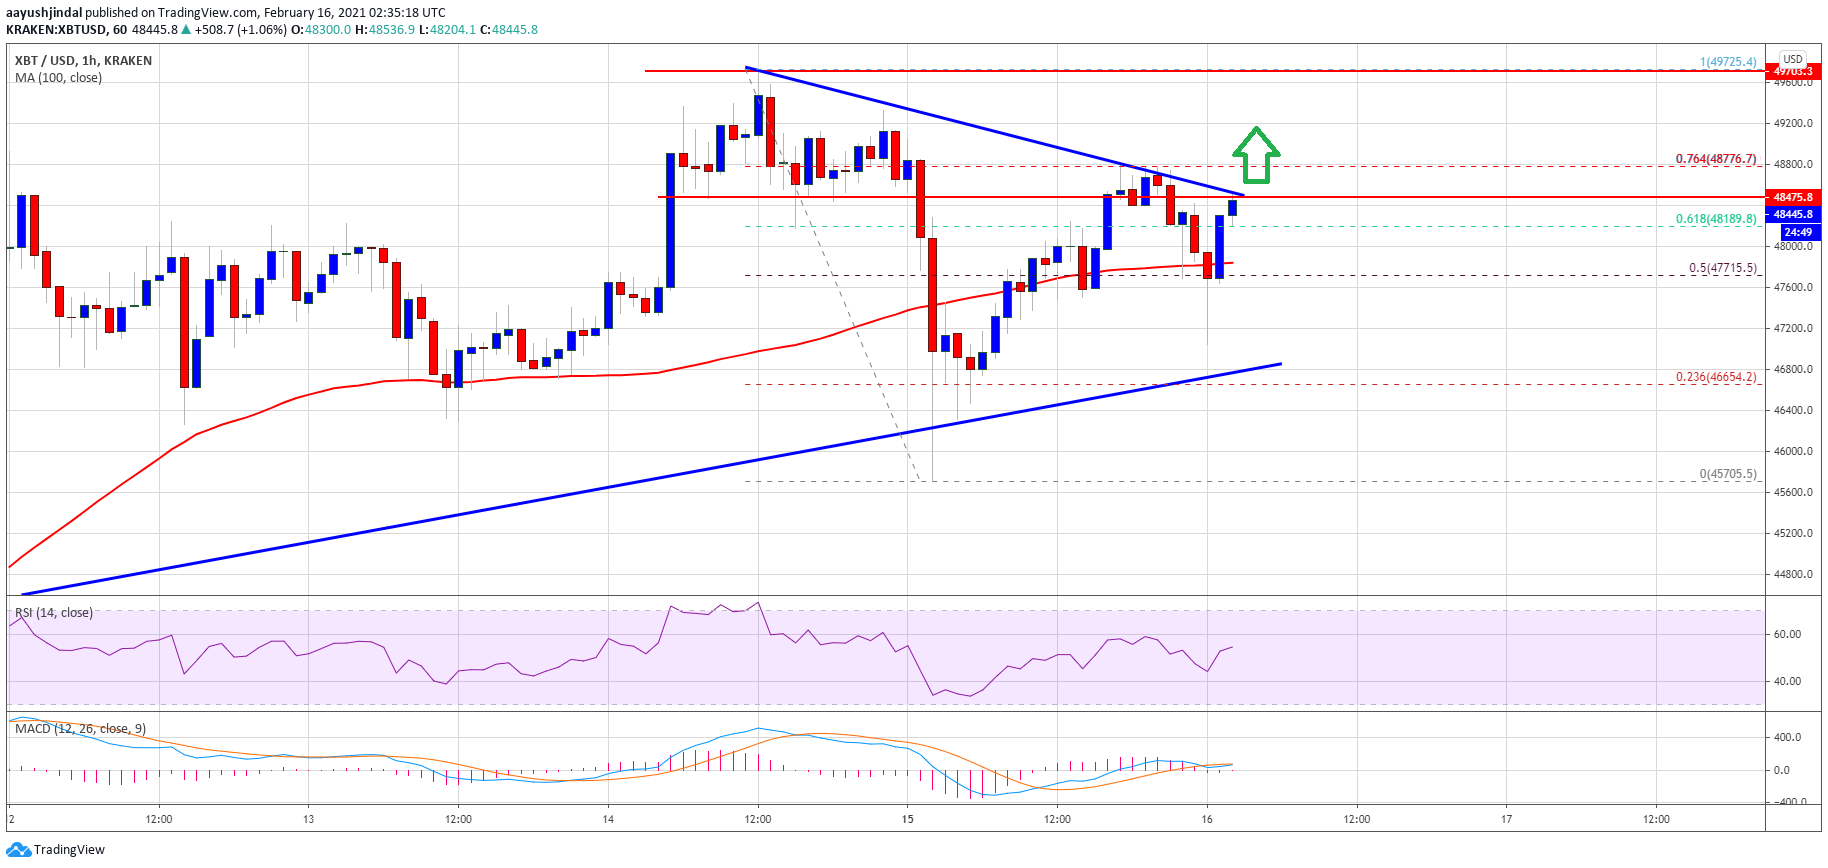
Source: BTCUSD on TradingView.com
The next key resistance is near the $49,000 level. An intermediate resistance sits near the 76.4% Fib retracement level of the downward move from the $49,700 swing high to $45,700 low.
A successful break above the trend line and then a follow up move above the $49,000 level may possibly start a strong increase in the coming sessions. The next major barrier for the bulls is near $50,000.
Fresh Dip in BTC?
If bitcoin fails to clear the trend line resistance or $49,000, it could start a fresh downside correction. An initial support is near the $48,000 level.
The first key support is near the $47,800 level and the 100 hourly simple moving average. Any more losses may possibly push the price lower towards the $47,000 support zone in the coming sessions.
Technical indicators:
Hourly MACD – The MACD is gaining momentum in the bullish zone.
Hourly RSI (Relative Strength Index) – The RSI for BTC/USD is now above the 50 level.
Major Support Levels – $47,800, followed by $47,000.
Major Resistance Levels – $48,500, $49,000 and $50,000.