
Reason to trust
How Our News is Made
Strict editorial policy that focuses on accuracy, relevance, and impartiality
Ad discliamer
Morbi pretium leo et nisl aliquam mollis. Quisque arcu lorem, ultricies quis pellentesque nec, ullamcorper eu odio.
Bitcoin price gained bullish momentum and broke the $50,000 resistance against the US Dollar. BTC is holding gains and it seems like it could rise further towards the $52,000 level.
- Bitcoin broke the $50,000 resistance and traded to a new all-time high near $50,600.
- The price is trading nicely near $50,000 and it is well above the 100 hourly simple moving average.
- There was a break above a key contracting triangle with resistance near $49,500 on the hourly chart of the BTC/USD pair (data feed from Kraken).
- The pair is likely to continue higher towards $52,000 as long as it is above the $48,000 support.
Bitcoin Price is Extending Gains
Finally, bitcoin price was able to clear the $50,000 resistance zone. BTC climbed above the $50,200 and $50,500 levels. It traded to a new all-time high at $50,600 before correcting lower.
There was a sharp correction below the $50,000 level. The price even spiked below the $49,000 support level. However, the bulls were active near the $48,000 zone and the 100 hourly simple moving average. A low is formed near $47,819 and the price is currently rising.
Bitcoin is trading above the 50% Fib retracement level of the downward correction from the $50,600 swing high to $47,819 low. There was also a break above a key contracting triangle with resistance near $49,500 on the hourly chart of the BTC/USD pair.
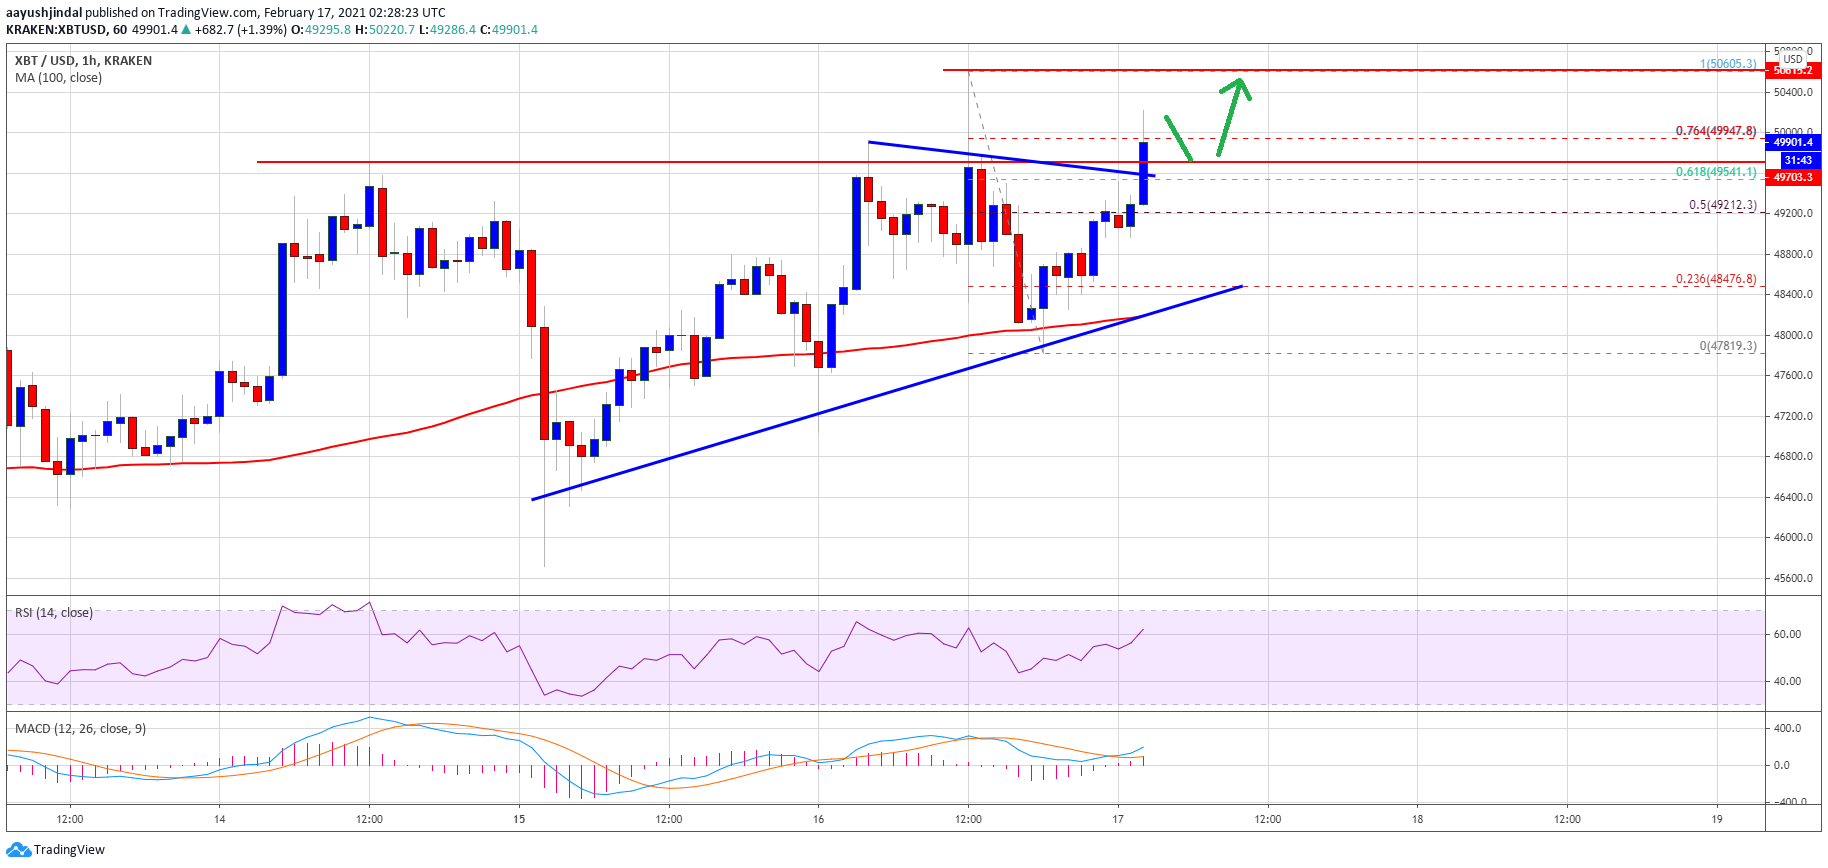
Source: BTCUSD on TradingView.com
The price is trading nicely near $50,000 and it is well above the 100 hourly simple moving average. It is testing the 76.4% Fib retracement level of the downward correction from the $50,600 swing high to $47,819 low.
It seems like the price is likely to continue higher towards the $50,600 high. Any more gains might easily push the price above the $51,000 level. The next key resistance sits at $52,000.
Fresh Dip in BTC?
If bitcoin fails to settle above the $50,000 and $50,200 levels, there could be a downside correction. An initial support is near the $49,500 level and the broken triangle trend line.
A downside break below the $49,500 level could lead the price towards the $48,000 support. The 100 hourly simple moving average is also sitting near $48,000 to provide support.
Technical indicators:
Hourly MACD – The MACD is gaining momentum in the bullish zone.
Hourly RSI (Relative Strength Index) – The RSI for BTC/USD is now well above the 50 level.
Major Support Levels – $49,500, followed by $49,000.
Major Resistance Levels – $50,500, $51,000 and $52,000.