
Reason to trust
How Our News is Made
Strict editorial policy that focuses on accuracy, relevance, and impartiality
Ad discliamer
Morbi pretium leo et nisl aliquam mollis. Quisque arcu lorem, ultricies quis pellentesque nec, ullamcorper eu odio.
Bitcoin price started a strong recovery from $53,000 against the US Dollar. BTC tested $50,000 and it could face a strong selling interest near $51K and $52K.
- Bitcoin started a decent upward move above the $48,000 resistance zone.
- The price is now trading well above $48,000 and the 100 hourly simple moving average.
- There was a break above a major contracting triangle with resistance near $47,500 on the hourly chart of the BTC/USD pair (data feed from Kraken).
- The pair could climb above $50,000 again, but it is likely to face sellers near $51,000 and $52,000.
Bitcoin Price is Recovering Losses
After testing the $43,000 zone, bitcoin started a decent recovery wave. BTC cleared the $45,000 and $46,500 resistance levels. The bulls gained strength, resulting in a move above the $47,000 level and the 100 hourly simple moving average.
There was also a break above a major contracting triangle with resistance near $47,500 on the hourly chart of the BTC/USD pair. The pair broke the $48,000 resistance and it even spiked above the $50,000 level.
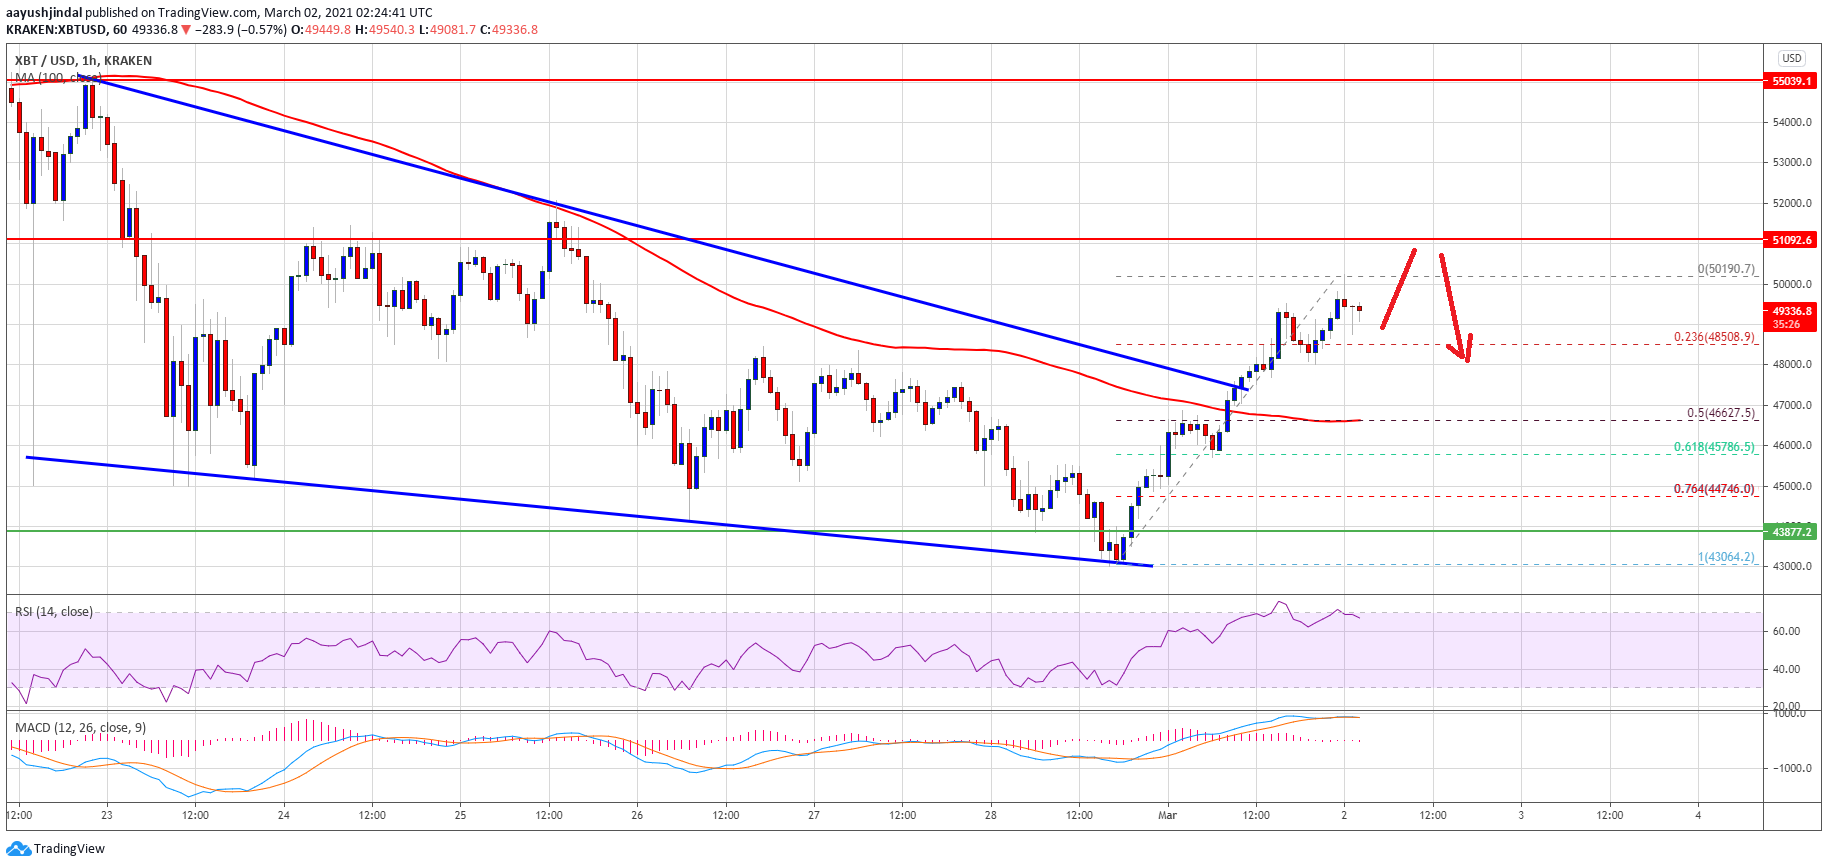
Source: BTCUSD on TradingView.com
A high is formed near $50,190 and the price is currently consolidating gains. An initial support is near the $48,500 level. It is close to the 23.6% Fib retracement level of the recent wave from the $43,064 low to $50,190 high.
On the upside, the price is likely to face a strong resistance near the $51,000 and $52,000 levels. A successful daily close above the $52,000 level is must for upside continuation. In the stated case, bitcoin price might revisit the $55,000 resistance in the near term.
Fresh Dip in BTC?
If bitcoin fails to continue higher above the $50,000 and $51,000 resistance levels, there could be a fresh decline. The first key support on the downside is near the $48,000 level.
The next major support is near the $46,500 level and the 100 hourly simple moving average. It is close to the 50% Fib retracement level of the recent wave from the $43,064 low to $50,190 high. If the bulls fail to protect the $46,500 support zone, there is a risk of a sharp decline towards the $43,000 support zone.
Technical indicators:
Hourly MACD – The MACD is slowly gaining momentum in the bullish zone.
Hourly RSI (Relative Strength Index) – The RSI for BTC/USD is now well above the 50 level.
Major Support Levels – $48,000, followed by $46,500.
Major Resistance Levels – $50,000, $51,000 and $52,000.


