
Reason to trust
How Our News is Made
Strict editorial policy that focuses on accuracy, relevance, and impartiality
Ad discliamer
Morbi pretium leo et nisl aliquam mollis. Quisque arcu lorem, ultricies quis pellentesque nec, ullamcorper eu odio.
Bitcoin price started a fresh increase above the $55,000 resistance zone against the US Dollar. BTC tested $58,500 and it remains elevated for a move towards the $60,000 zone.
- Bitcoin is showing positive signs and it recently tested the $58,500 resistance zone.
- The price is now trading well above $55,000 and the 100 simple moving average (4-hours).
- There is a key bullish trend line forming with support near $55,400 on the 4-hours chart of the BTC/USD pair (data feed from Kraken).
- The pair could correct losses, but it is likely to start a steady increase towards the $60,000 level.
Bitcoin Price Gains Traction
This past week, bitcoin price remained stable above the $52,500 support zone against the US Dollar. The BTC/USD pair started a steady increase and it broke a couple of important hurdles near $55,000.
The price even broke the $56,500 resistance and extended its rise. There was a spike above the $58,000 level, but the price struggled near the $58,500 zone. A high is formed near $58,494 and the price is now correcting lower.
It traded below the $57,500 level. There was a break below the 23.6% Fib retracement level of the upward move from the $52,489 swing low to $58,494 high. On the downside, there is a major support forming near the $55,500 zone.
There is also a key bullish trend line forming with support near $55,400 on the 4-hours chart of the BTC/USD pair. The trend line is close to the 50% Fib retracement level of the upward move from the $52,489 swing low to $58,494 high.
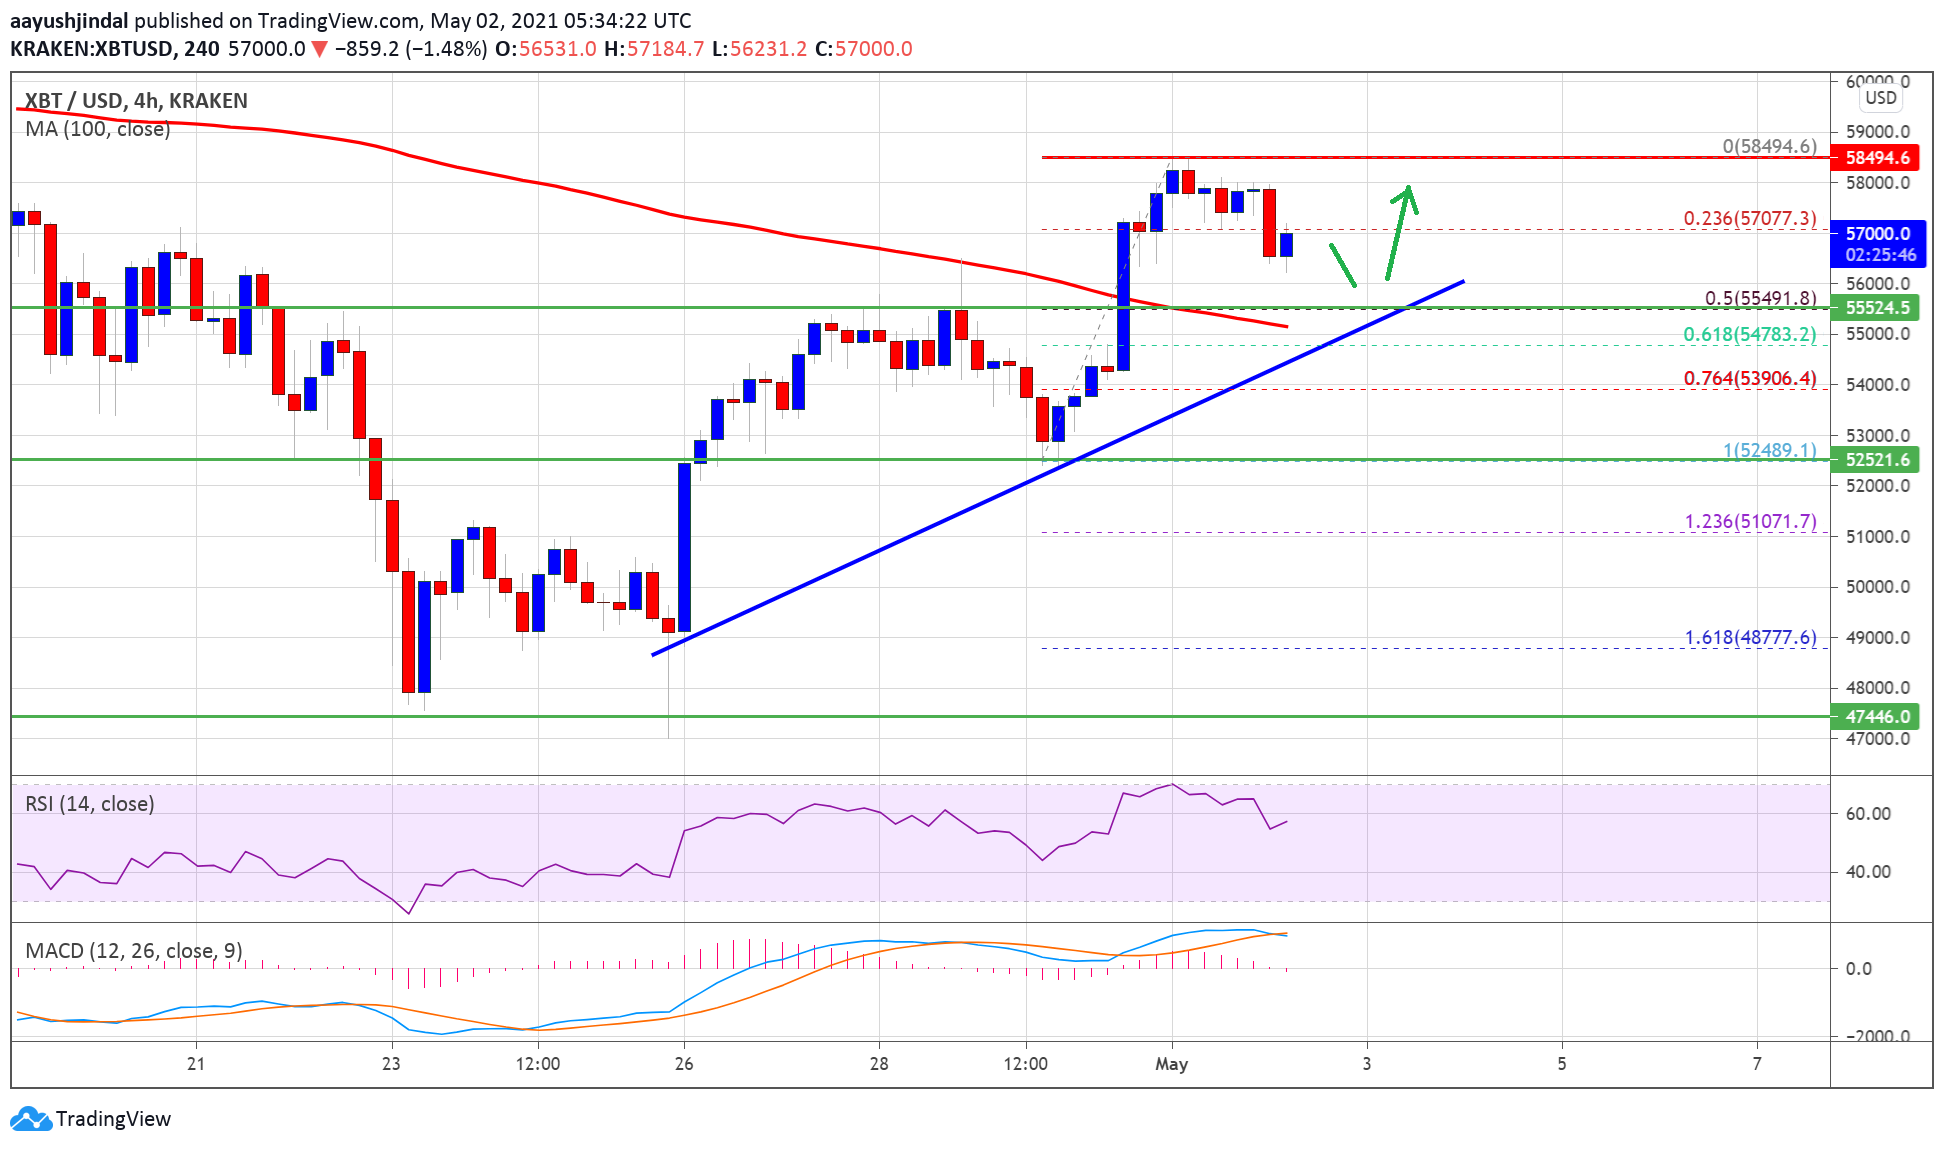
Source: BTCUSD on TradingView.com
On the upside, the price is facing a major resistance near the $58,000 and $58,500 levels. A successful close above the $58,000 and $58,500 resistance levels could open the doors for a fresh increase towards the $60,000 barrier.
Dips Limited in BTC?
If bitcoin fails above the $58,000 level, there is a risk of a downside correction. The first major support is near the $55,500 level and the trend line zone.
The next major support is near the $55,000 level and the 100 SMA. Any more losses might call for a fresh drop towards the $52,500 support level.
Technical indicators
4 hours MACD – The MACD for BTC/USD is losing momentum in the bullish zone.
4 hours RSI (Relative Strength Index) – The RSI for BTC/USD is now well above the 50 level.
Major Support Level – $55,500
Major Resistance Level – $58,500